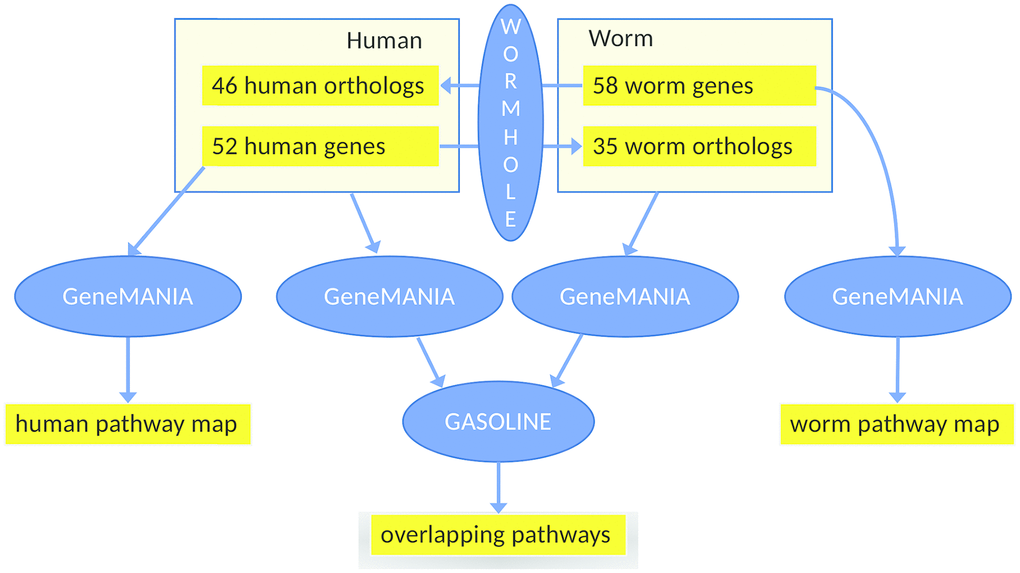
Figure 4.Workflow of the main analysis steps. First, 52 human health genes (Supplementary Tables 1–3) were processed with GeneMANIA and AutoAnnotate to determine the human healthspan pathway map (left, see also Figure 1). Analogously, 58 worm health genes (based on gene expression analysis using WormBase) were studied, yielding the C. elegans healthspan pathway map (right, see also Figure 3). Then, to determine overlap across species, the gene lists were extended by the orthologs (calculated by WORMHOLE, see Supplemental Methods) from the respective other species. We then employed GeneMANIA as before, to generate two interaction networks (one per list). and overlaps between these two networks of health genes were determined by GASOLINE (middle, see also Figure 5).