Submit an Article
Navigate
Home
Editorial Board
Editorial Policies
Current Volume
Archive
Scientific Integrity
Publication Ethics Statements
Interviews with Outstanding Authors
Newsroom
Sponsored Conferences
Podcast
Contact
Special Collections
Submit an Article
Online ISSN: 1945-4589
Research Paper
|
Volume 12, Issue 13
|
pp. 12534–12581
Healthspan pathway maps in
C. elegans
and humans highlight transcription, proliferation/biosynthesis and lipids
Back to article
Figure 3
(3 of 5)
−
100%
+
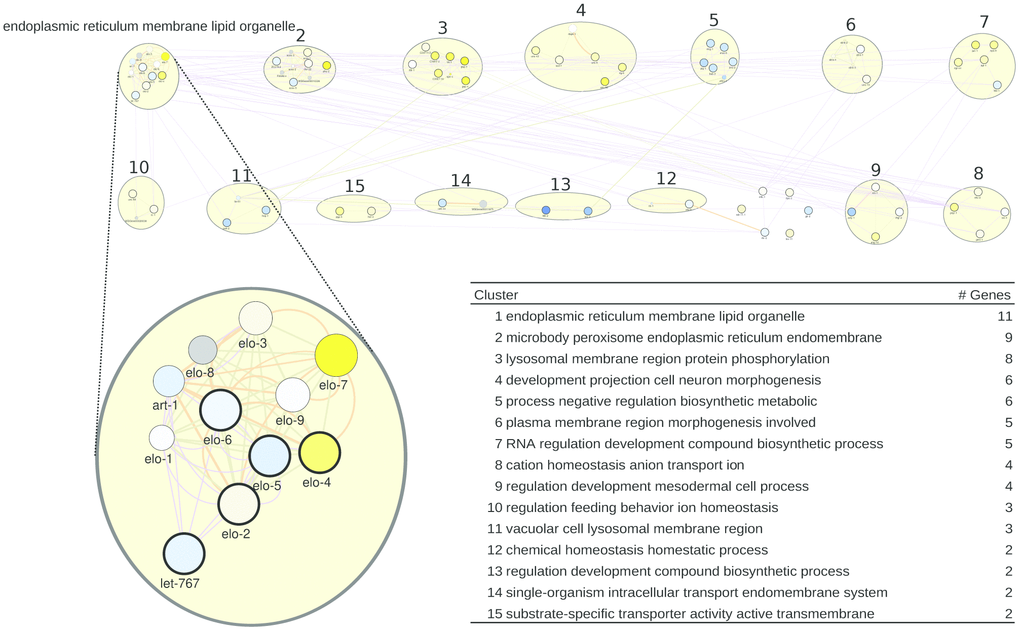
Figure 3.
A healthspan pathway map for
C. elegans
, based on genes affected the most by healthspan-extending interventions, using WormBase gene expression data. See also
Figures 1
,
2
.