Submit an Article
Navigate
Home
Editorial Board
Editorial Policies
Current Volume
Archive
Scientific Integrity
Publication Ethics Statements
Interviews with Outstanding Authors
Newsroom
Sponsored Conferences
Podcast
Contact
Special Collections
Submit an Article
Online ISSN: 1945-4589
Research Paper
|
Volume 12, Issue 13
|
pp. 12517–12533
Untargeted metabolomics for uncovering biological markers of human skeletal muscle ageing
Back to article
Figure 1
(2 of 4)
−
100%
+
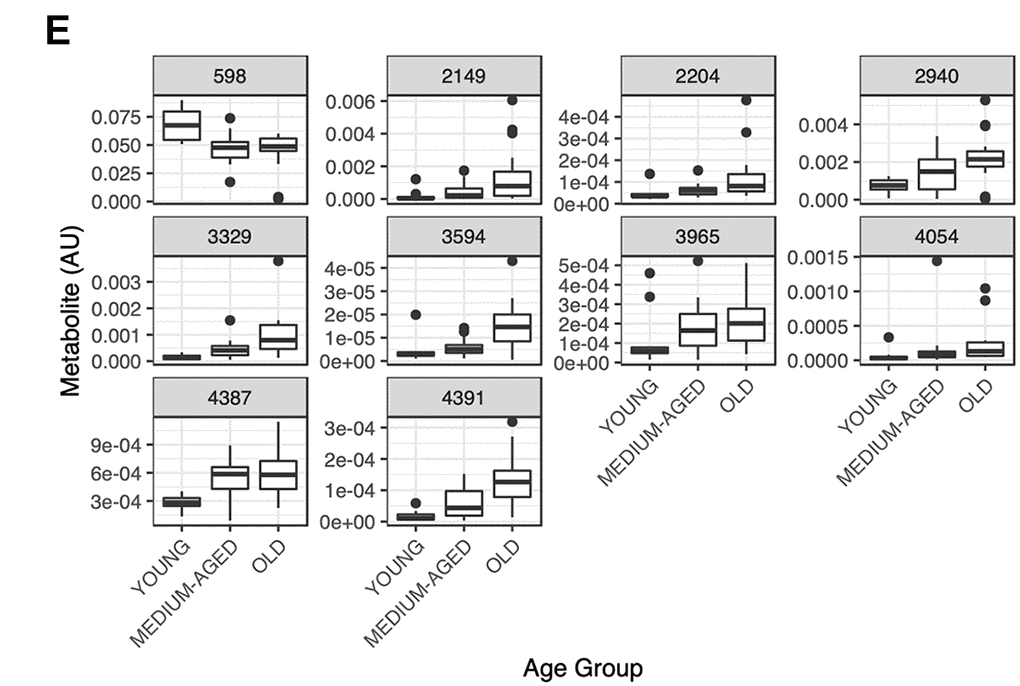
Figure 1.
(
E
) Representative boxplots for RF selected metabolites showing differences in metabolite abundance across age groups for these variables.