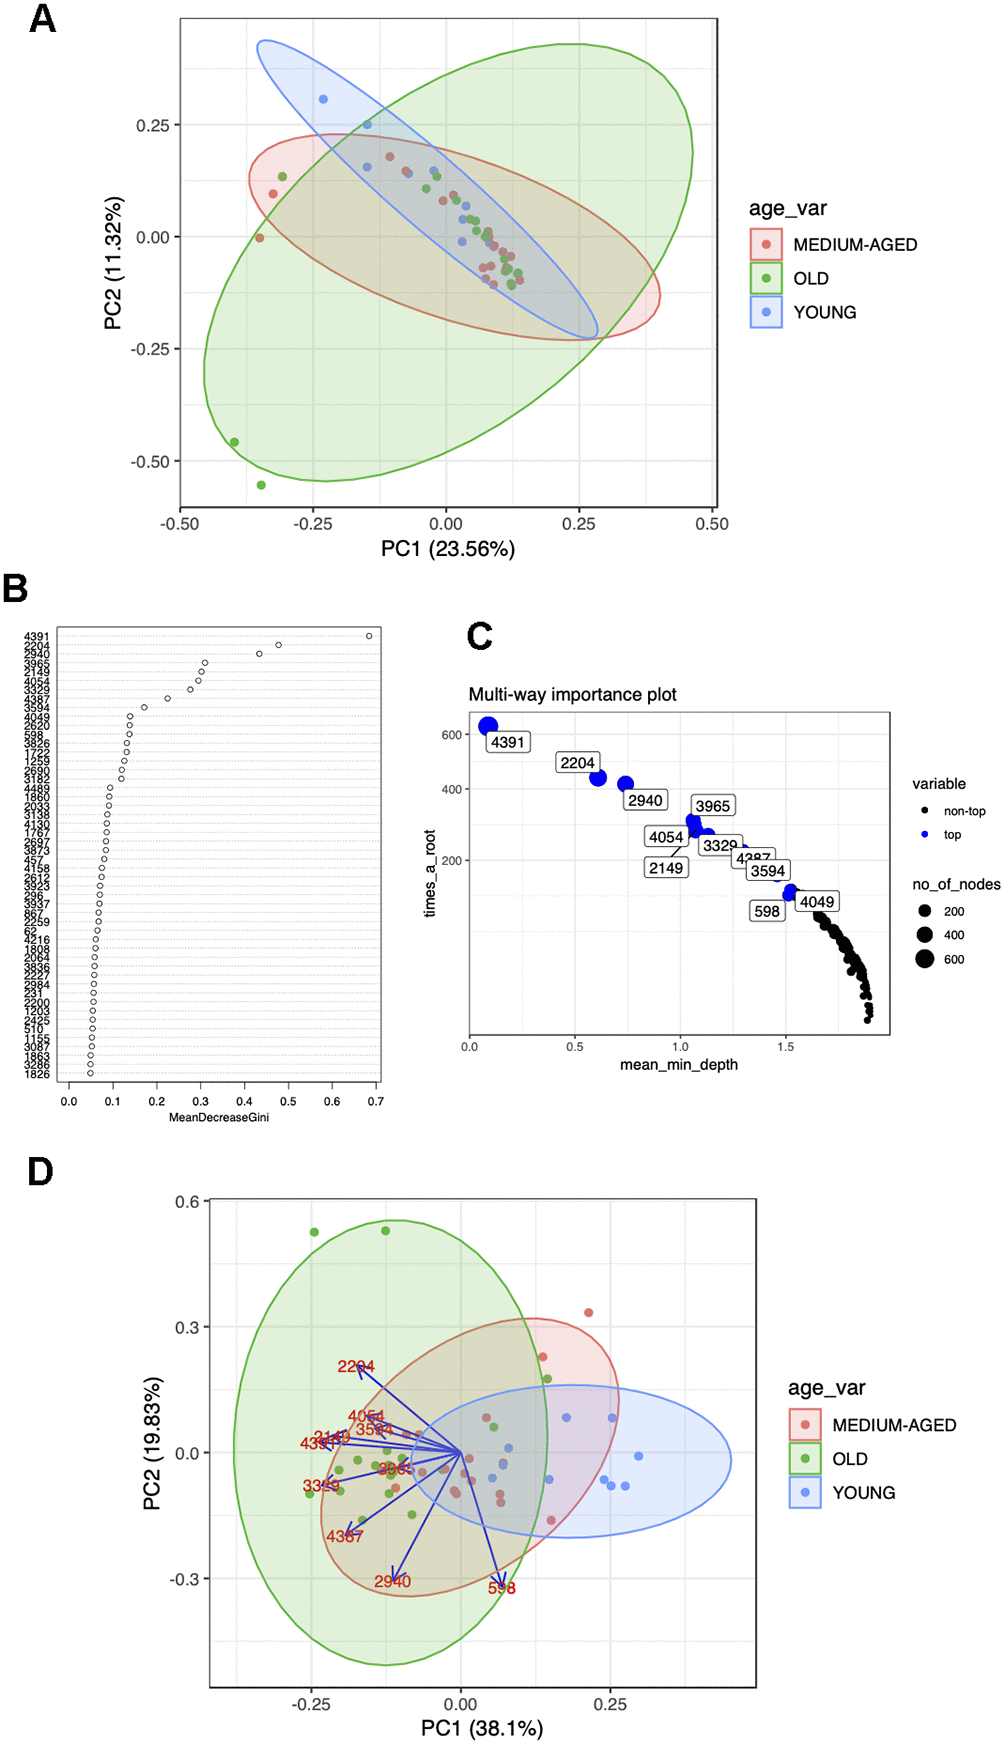
Figure 1.(A) Pre RF PCA plot showing overlap of age groups and no defined clusters of metabolites predictive of age group for polar positive data. (B) Example variable importance and (C) multi-way importance plots generated from RF for polar positive data and the use of the randomForestExplainer R package. The most important predictive metabolites are selected out via Gini index and the top 10 (although arbitrary, this is generally selected as to where the variable importance falls off, ie as shown in the plot of panel B) selected for each polarity and ion mode to go forward for further analyses. (D) Post RF PCA plot for polar positive data, reduction of data to those metabolites most predictive of age shows clustering of age groups with most variability between age groups contained in PC1, with the direction and degree of correlation between each metabolite driving this difference shown through the loadings.
() Representative boxplots for RF selected metabolites showing differences in metabolite abundance across age groups for these variables.