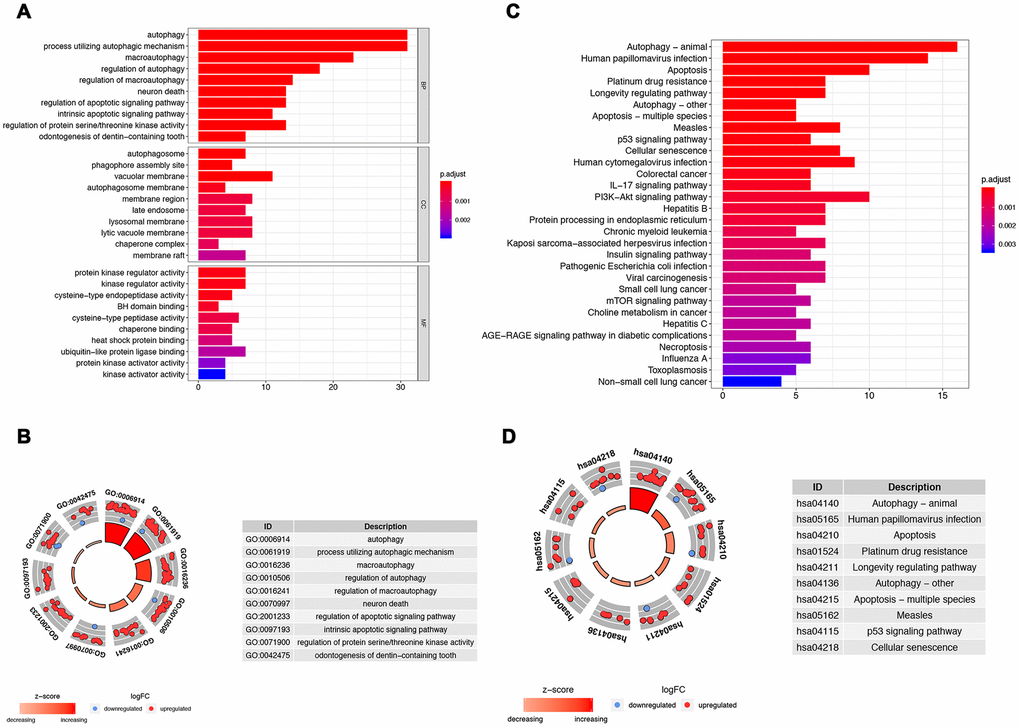
Figure 2.Gene functional enrichment analysis for the ARGs. (A, B) Show, by the GO analysis, the biological process and molecular functions that the ARGs are involved in; (C, D) Show the KEGG analysis for potential pathways by which these ARGs exert their effects on tumor cells.