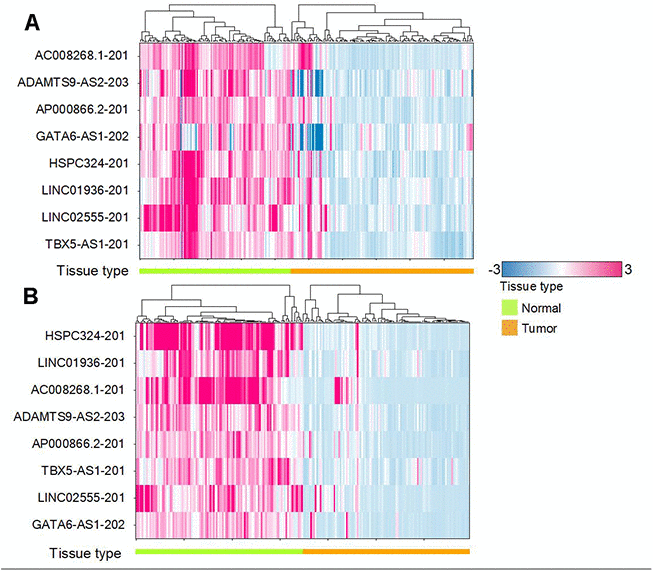
Figure 5.Hierarchical clustering shows the regulation. (A) Heat map for 8 common lncRNAs in the Microarray dataset. (B) Heat map for 8 common lncRNAs in the TCGA dataset. Red means upregulation while blue means downregulation. We can see that all the 8 common lncRNA downregulated in tumor samples.