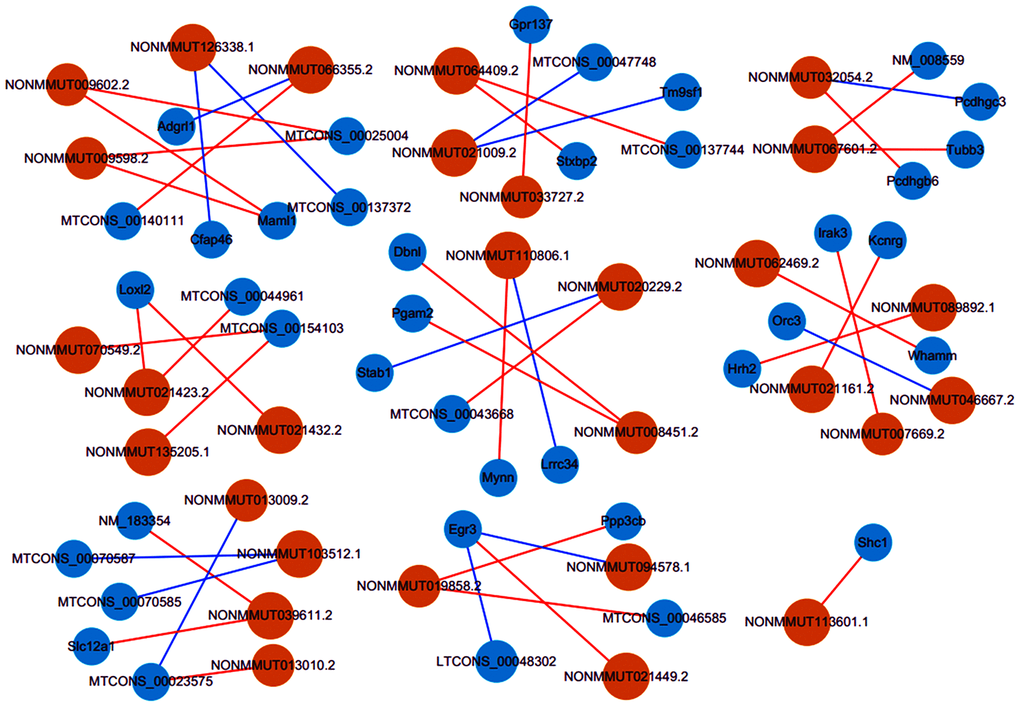
Figure 7.Co-expression networks of thirty lncRNAs with related mRNAs. Via rigorous screening progress (PCC > 0.90 or < -0.90, P < 0.01), the pairs for co-expressed lncRNA-mRNA were screened. Blue circles represent mRNAs, and orange circles denote lncRNAs. Blue lines show a negative correlation, and red lines indicate a positive correlation. PCC, Pearson correlation coefficient.