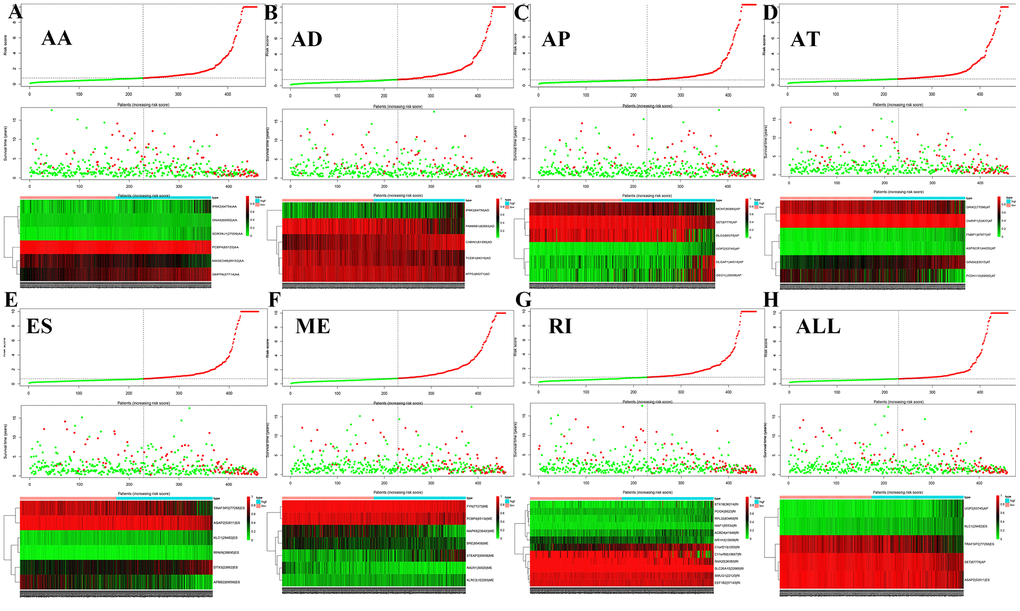
Figure 5.Survival risk assessment of prognosis-related AS events. The distribution of survival time, status and risk score in low- and high-risk groups were shown in all types of AS events, (A) AA, (B) AD, (C) AP, (D) AT, (E) ES, (F) ME, (G) RI and (H) all types of AS events.