Submit an Article
Navigate
Home
Editorial Board
Editorial Policies
Current Volume
Archive
Scientific Integrity
Publication Ethics Statements
Interviews with Outstanding Authors
Newsroom
Sponsored Conferences
Podcast
Contact
Special Collections
Submit an Article
Online ISSN: 1945-4589
Research Paper
|
Volume 12, Issue 18
|
pp. 17948–17957
Constructing a global transcriptional regulatory landscape for early non-small cell lung cancer to identify hub genes and key pathways
Back to article
Figure 3
(3 of 7)
−
100%
+
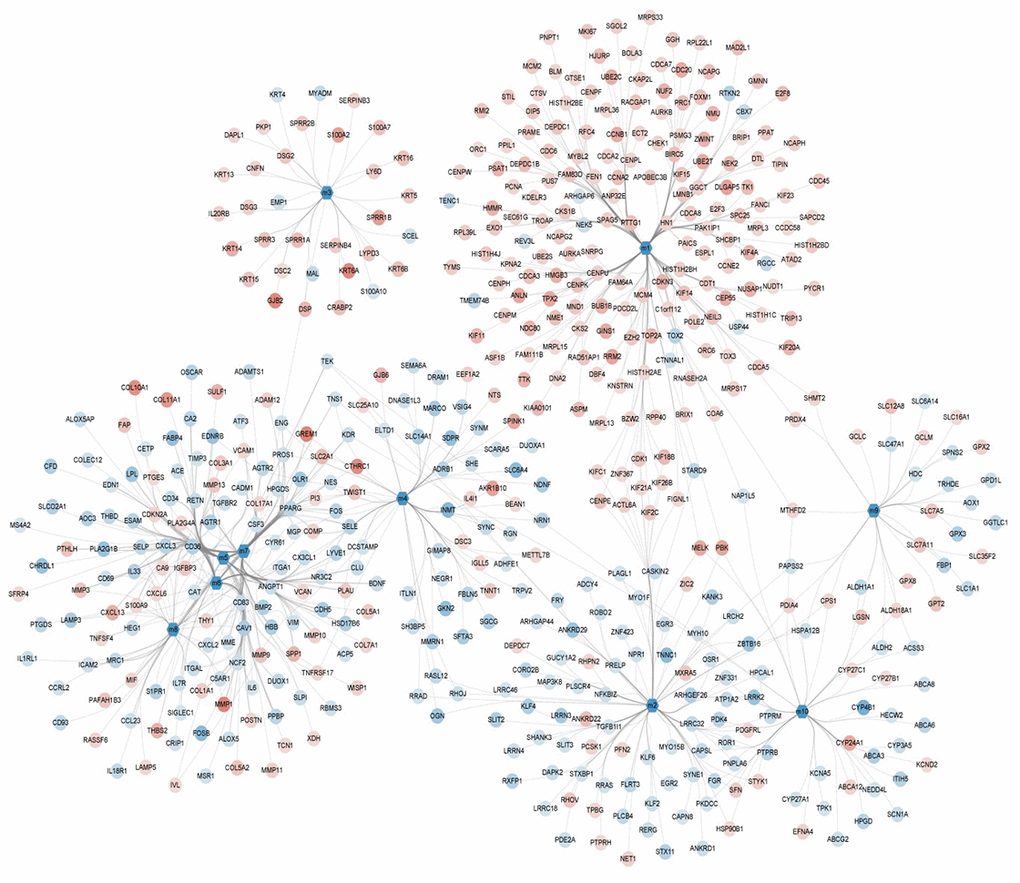
Figure 3.
Module network showing the modules and their gene members with color mapping logFC of their differential expressions.