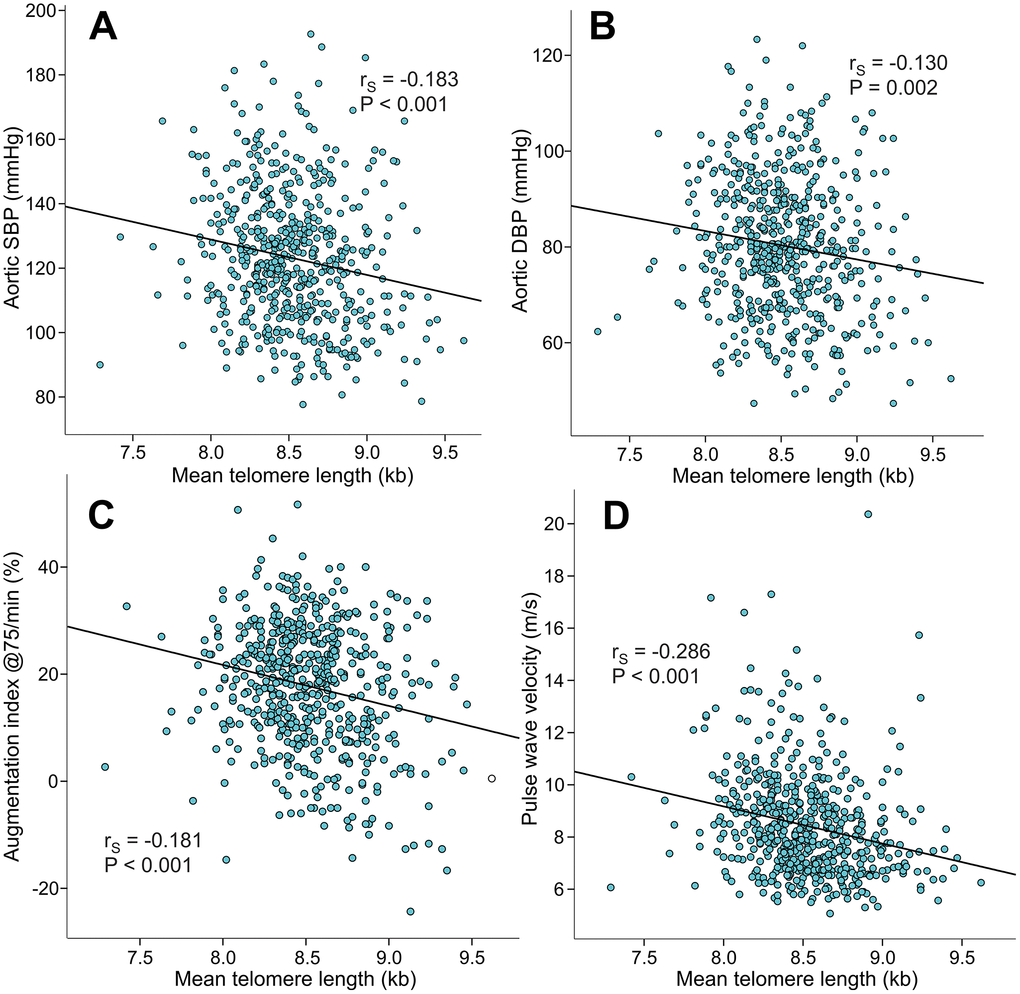
Figure 3.Scatter plots and Spearman correlations (rS) between mean leukocyte telomere length and aortic systolic blood pressure (A), aortic diastolic blood pressure (B), augmentation index at heart rate 75/min (C), and pulse wave velocity (D) in the 566 study subjects.