Submit an Article
Navigate
Home
Editorial Board
Editorial Policies
Current Volume
Archive
Scientific Integrity
Publication Ethics Statements
Interviews with Outstanding Authors
Newsroom
Sponsored Conferences
Podcast
Contact
Special Collections
Submit an Article
Online ISSN: 1945-4589
Research Paper
|
Volume 12, Issue 12
|
pp. 12376–12392
Leukocyte telomere length is inversely associated with arterial wave reflection in 566 normotensive and never-treated hypertensive subjects
Back to article
Figure 1
(1 of 3)
−
100%
+
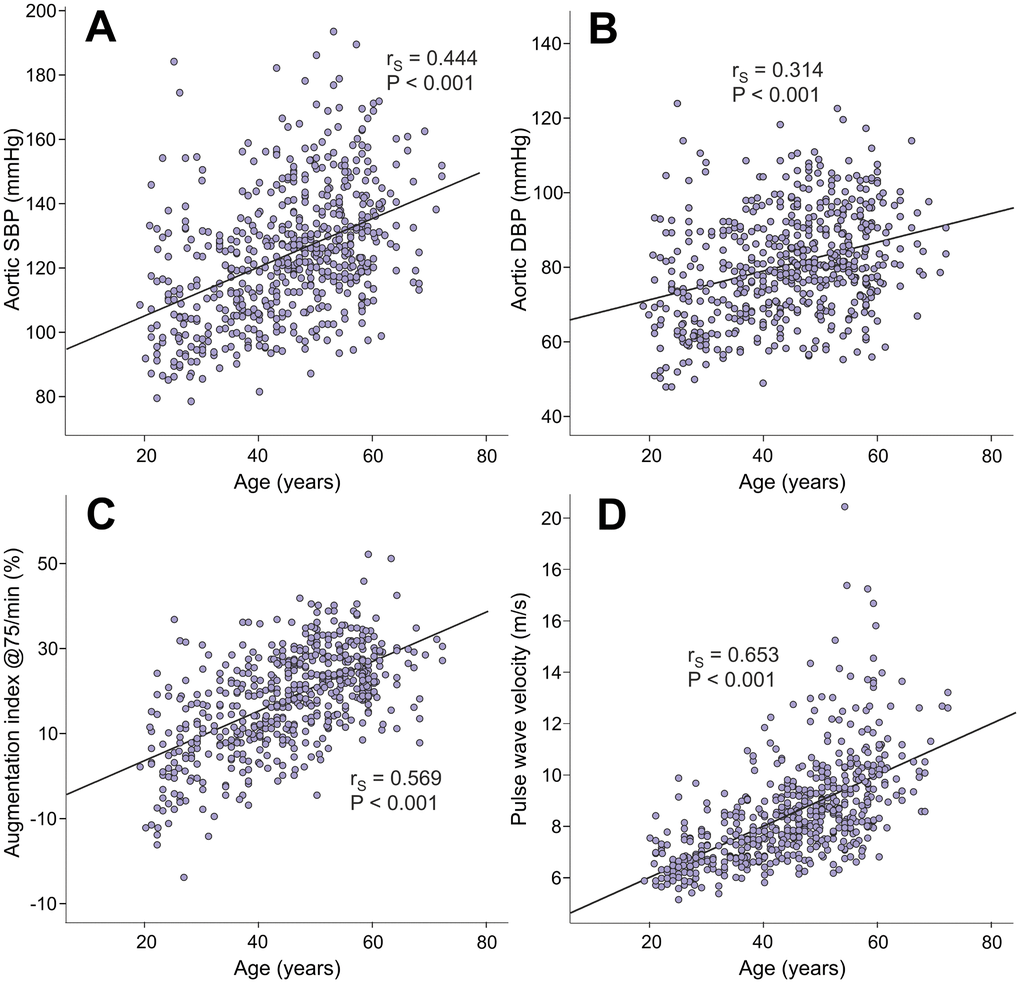
Figure 1.
Scatter plots and Spearman correlations (r
S
) between age and aortic systolic blood pressure (
A
), aortic diastolic blood pressure (
B
), augmentation index at heart rate 75/min (
C
), and pulse wave velocity (
D
) in the 566 study subjects.