Submit an Article
Navigate
Home
Editorial Board
Editorial Policies
Current Volume
Archive
Scientific Integrity
Publication Ethics Statements
Interviews with Outstanding Authors
Newsroom
Sponsored Conferences
Podcast
Contact
Special Collections
Submit an Article
Online ISSN: 1945-4589
Research Paper
|
Volume 12, Issue 14
|
pp. 14271–14284
Analysis of the expression and genetic alteration of CLDN18 in gastric cancer
Back to article
Figure 1
(1 of 9)
−
100%
+
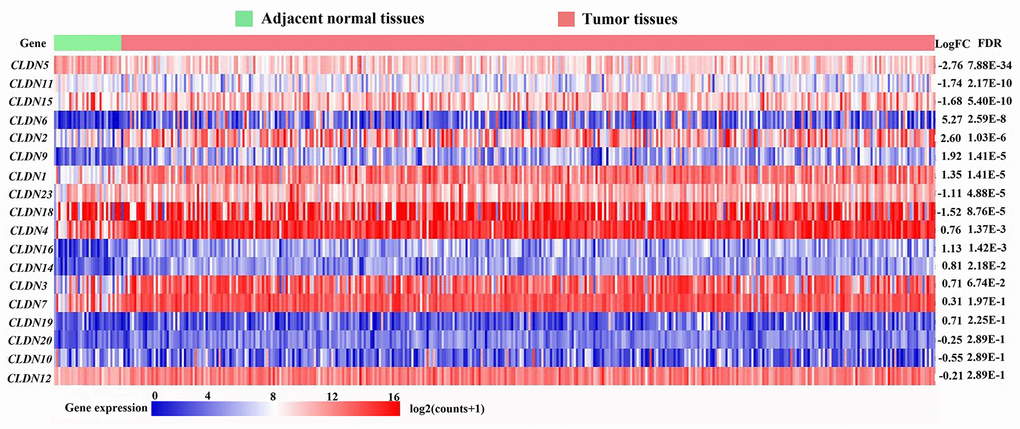
Figure 1.
Heatmap of transcriptional profiles of the
CLDN
family in tumor and adjacent normal tissues from the TCGA-STAD database.
FC, fold change; FDR, false discovery rate.