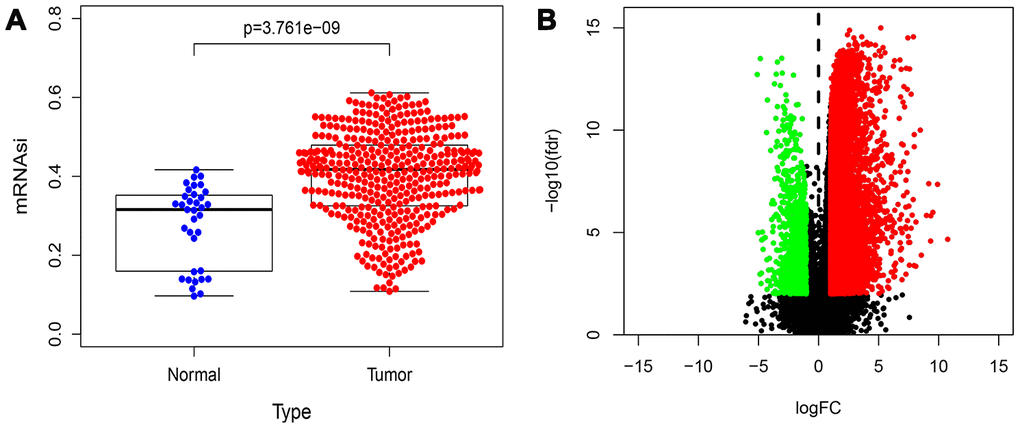
Figure 2.Distribution map of mRNAsi and DEGs in HCC. (A) Distribution map shows the mRNAsi of genes in HCC and control samples from the study published by Malta et al. The X axis is sample type (Normal or Tumor) and the Y axis is mRNAsi. (B) The volcano plot shows the expression profiles of 7498 DEGs in HCC samples compared to normal liver samples from the TGCA database. The low expressing genes (n=394) are shown in green and the high expressing genes (n=7104) are shown in red. The threshold criteria are FDR/fdr=0.01 and log2FC=1.