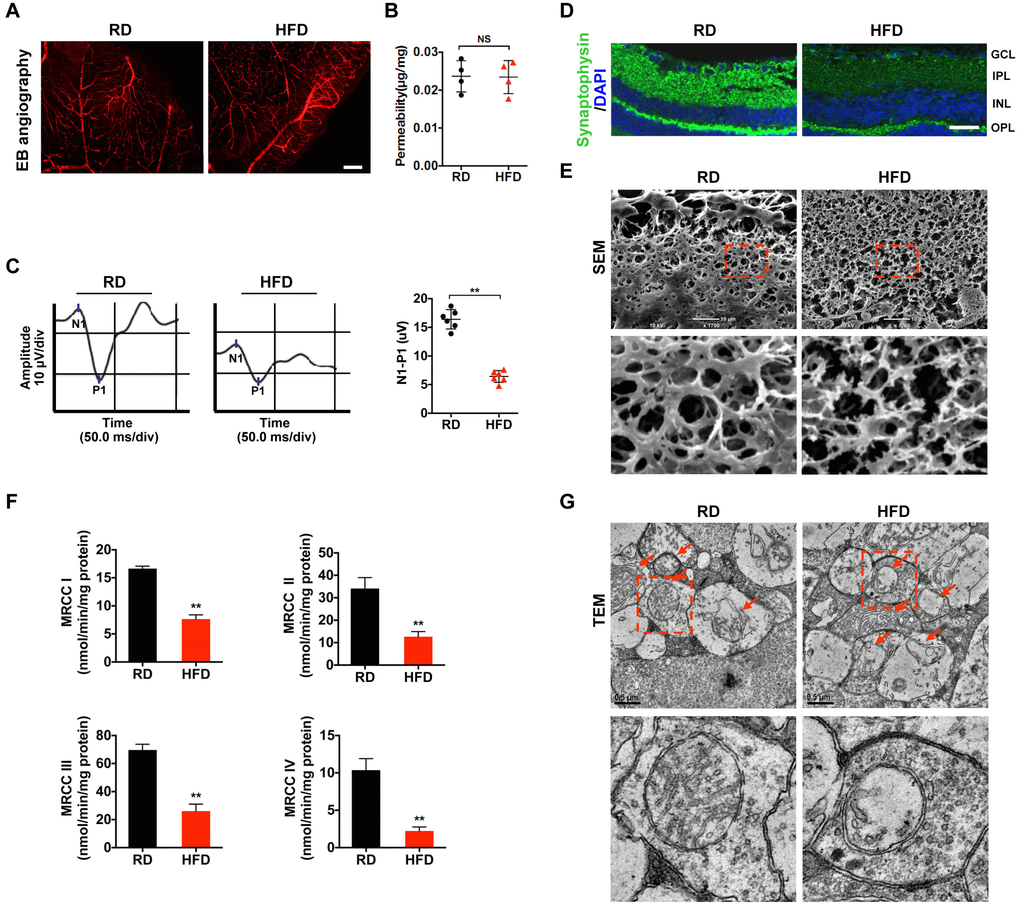
Figure 1.Mitochondrial impairment is associated with HFD-induced diabetic retinal neurodegeneration. (A) Representative images of retinal Evans Blue (EB) angiography from mice fed with regular chow (RD) or HFD for 20 weeks. Scale bar, 150 μm. (B) Retinal vascular leakage was quantified and normalized by total retinal protein concentrations, and expressed as μg of EB per mg of proteins. NS, no significant difference. (C) Representative waveforms of visual evoked potential (VEP). The differences in peak amplitude (N1-P1) were quantified. (D) Representative retinal immunofluorescence staining for synaptophysin (green). Nuclei were counterstained with DAPI (blue). Scale bar, 100 μm. GCL, ganglion cell layer; IPL, inner plexiform layer; INL, inner nuclear layer; OPL, outer plexiform layer. (E) Representative scanning electron microscopy (SEM) of retinal sections. Lower panels are high-power magnification of the areas indicated by the boxes. Scale bar, 10 μm. (F) Activities of retinal mitochondrial complex I-IV (MRCC I-IV) were measured by spectrophotometry and expressed as nmol/min/mg protein. Two retinae from 2 respective mice in the same group were pooled and preceded for each experiment. Three independent experiments were performed in duplicate for each group. (G) Representative transmission electron microscopy (TEM) of neural retinal sections. Mitochondria in IPL are indicated with arrows. Lower panels are high-power magnification of the areas indicated by the boxes. Scale bar, 0.5 μm. Data are means ± SEM. n = 4 (A, B) or n = 6 (C–G) mice per group. **P < 0.01 vs age-match RD controls. See also Supplementary Figure 1; Supplementary Figures 2A and 3A.