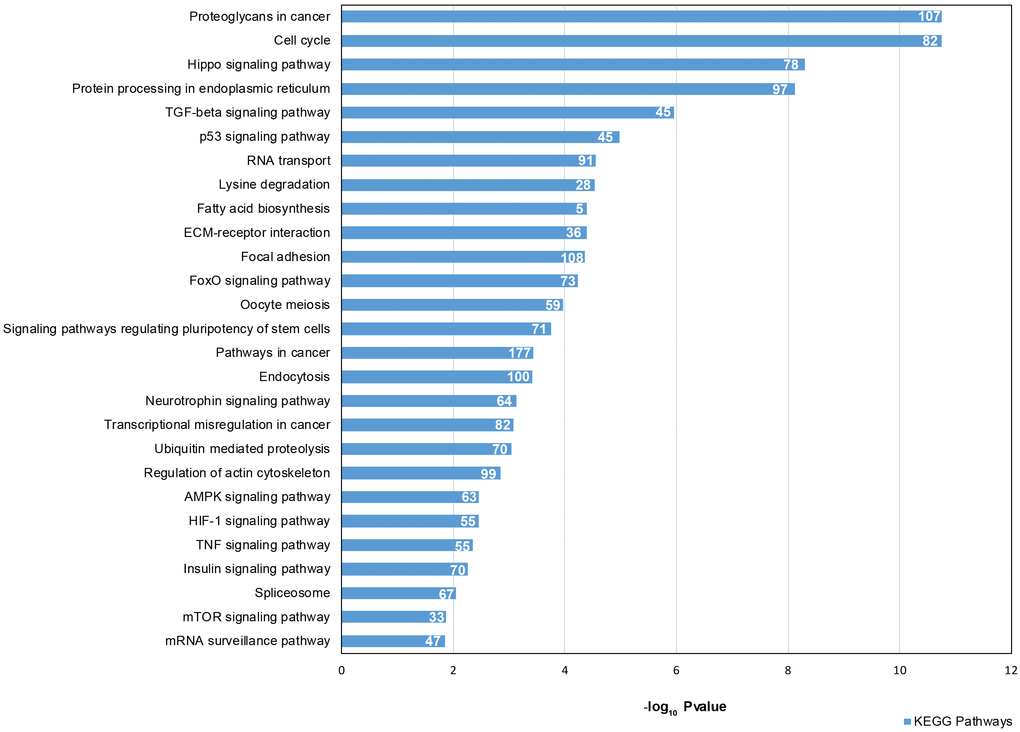
Figure 5.Signaling Pathway enrichment analysis for 46 DE common miRNAs with KEGG. The x-axis represents the -log10(P-value). The number of target genes in each molecular pathway is shown.
Figure 5 — Ovarian aging increases small extracellular vesicle CD81+ release in human follicular fluid and influences miRNA profiles | Aging