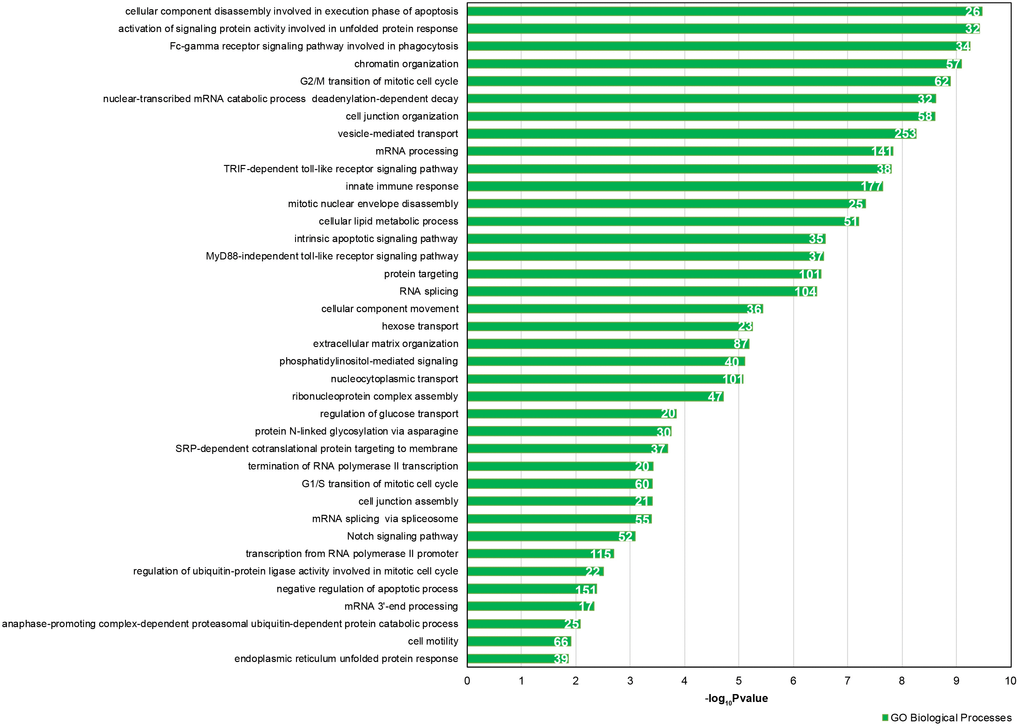
Figure 4.GO enrichment analysis for 46 DE common miRNAs identified by two normalization methods. Bar chart representing the most highly statistically enriched Gene Ontologies, in terms of Biological Processes, for DE miRNA targets in female reproductive aging. The x-axis represents the -log10(P-value). The number of target genes in each GO category is shown.