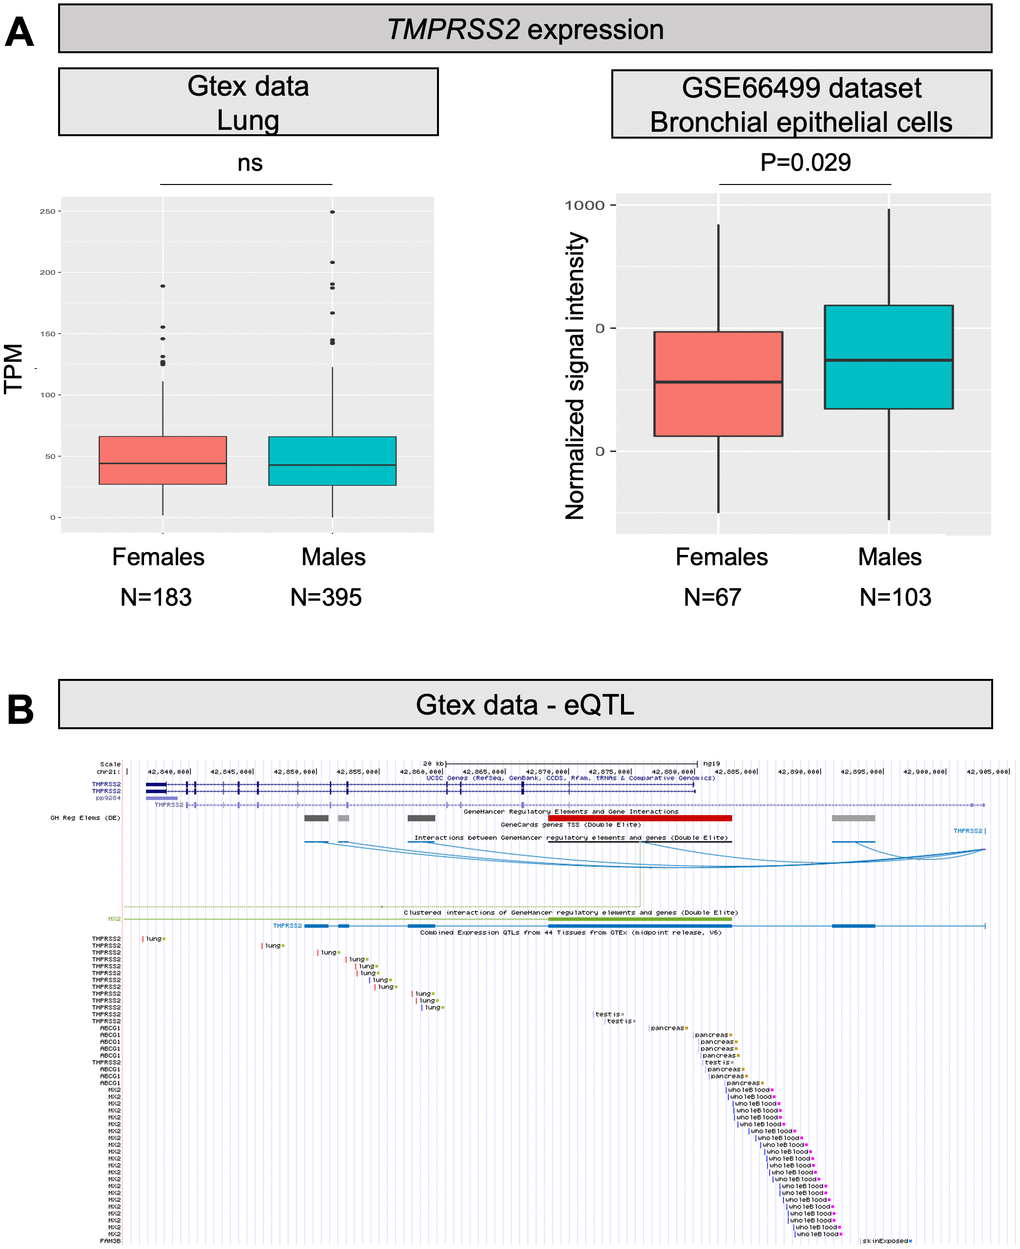
Figure 2.TMPRSS2 expression levels and eQTLs. (A) Both panels show TMPRSS2 mRNA expression levels in human normal lung samples stratified according to sex. On the left, data were retrieved for a total of 578 RNAseq experiments from the GTex repository. Expression levels are reported as transcripts per kilobase million (TPM). On the right, data were collected for a total of 170 microarray experiments from the GEO database. Expression levels are reported as normalized signal intensities. P values were calculated by using either the Kruskal-Wallis or the student t test. (B) Screenshot from the UCSC Genome browser (http://genome.ucsc.edu/; GRCh37/hg19) highlighting the TMPRSS2 region (coordinates chr21: 42,835,000-42,905,000). The panel shows the following tracks: i) the ruler with the scale at the genomic level; ii) chromosome 21 nucleotide numbering; iii) the UCSC RefSeq track; iv) enhancers (grey and red bars) from GeneHancer database; v) interactions (curved lines) connecting GeneHancer regulatory elements and genes: all curved lines converge towards the androgen-responsive enhancer for the TMPRSS2 gene described by Clinckemalie and colleagues [29].