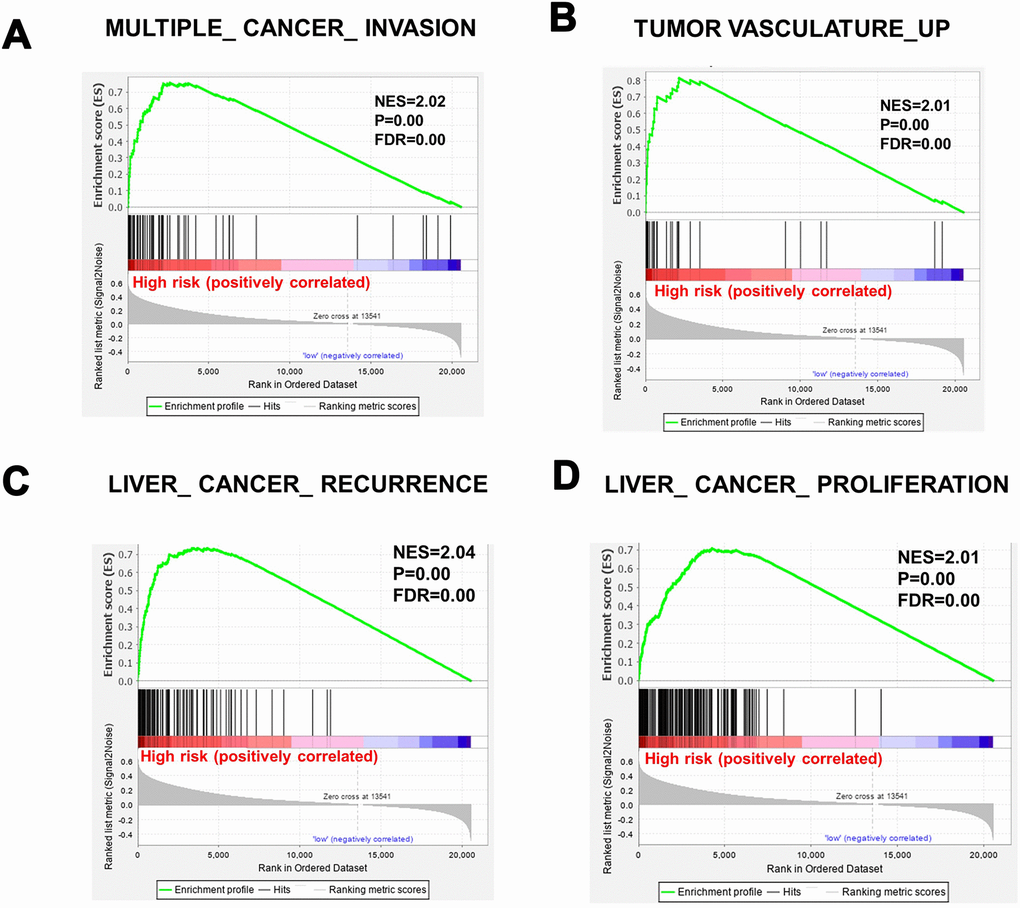
Figure 4.Gene sets significantly enriched between high-risk patients and low-risk patients, determined using GSEA. (A) MULTIPLE_CANCER_INVASION. (B) TUMOR VASCULATURE_UP. (C) LIVER_ CANCER_ RECURRENCE. (D) cell proliferation. NES, normalized enrichment score; FDR: false discovery rate.