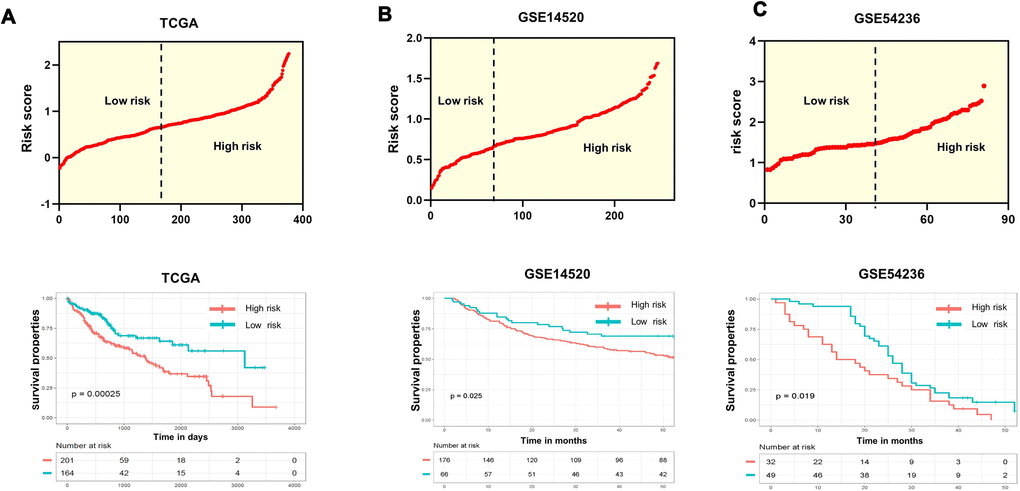
Figure 2.Evaluation and validation of the survival predictions of the risk scoring system. (A–C) Risk score distribution (upper) and Kaplan-Meier curves (lower) classifying patients into high- and low-risk groups by the new scoring system by comparing OS for patients in high- and low-risk groups in the training datasets and two test datasets. Patients with expression levels higher than the mean value are categorized into the high-risk group, while those with expression levels lower than the mean value are categorized into the low-risk group. P values were calculated by the log-rank test.