Submit an Article
Navigate
Home
Editorial Board
Editorial Policies
Current Volume
Archive
Scientific Integrity
Publication Ethics Statements
Interviews with Outstanding Authors
Newsroom
Sponsored Conferences
Podcast
Contact
Special Collections
Submit an Article
Online ISSN: 1945-4589
Research Paper
|
Volume 12, Issue 14
|
pp. 14092–14124
Blood DNA methylation sites predict death risk in a longitudinal study of 12, 300 individuals
Back to article
Figure 2
(2 of 4)
−
100%
+
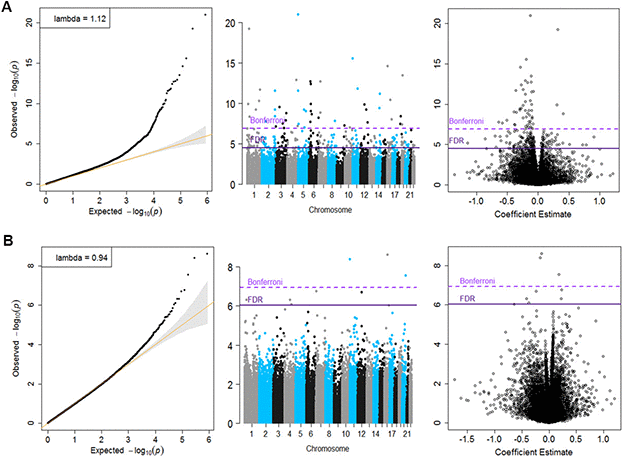
Figure 2.
Quantile-Quantile plots, Manhattan and Volcano for the basic model (Panel A) and for the fully adjusted model (Panel B).