Submit an Article
Navigate
Home
Editorial Board
Editorial Policies
Current Volume
Archive
Scientific Integrity
Publication Ethics Statements
Interviews with Outstanding Authors
Newsroom
Sponsored Conferences
Podcast
Contact
Special Collections
Submit an Article
Online ISSN: 1945-4589
Research Paper
|
Volume 12, Issue 13
|
pp. 13160–13171
A validated survival nomogram for early-onset diffuse gastric cancer
Back to article
Figure 4
(4 of 7)
−
100%
+
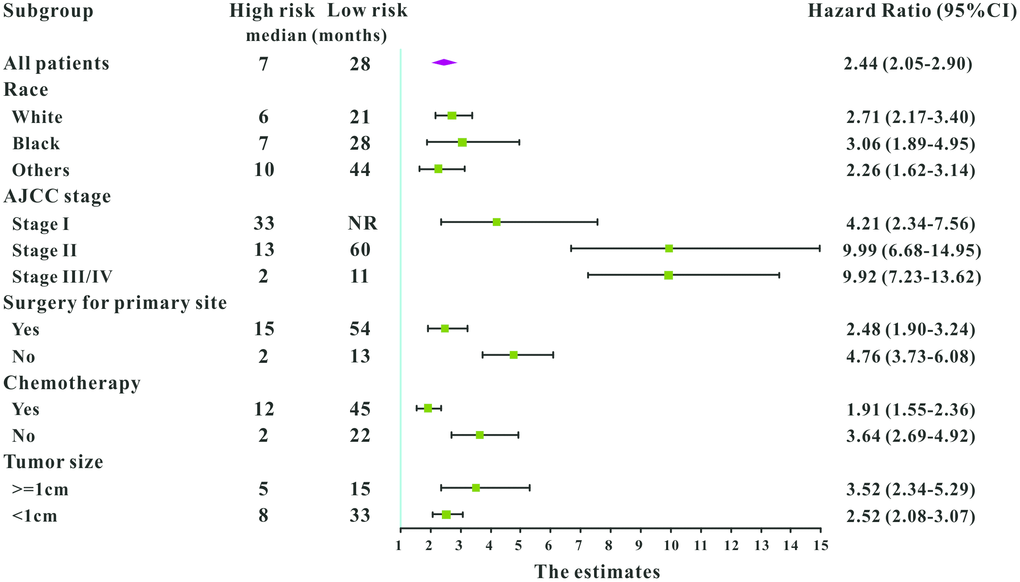
Figure 4.
Subgroup analysis of associations between selected factors and all-cause mortality among high-risk and low-risk patients, grouped by the mean point predicted by the survival nomogram.