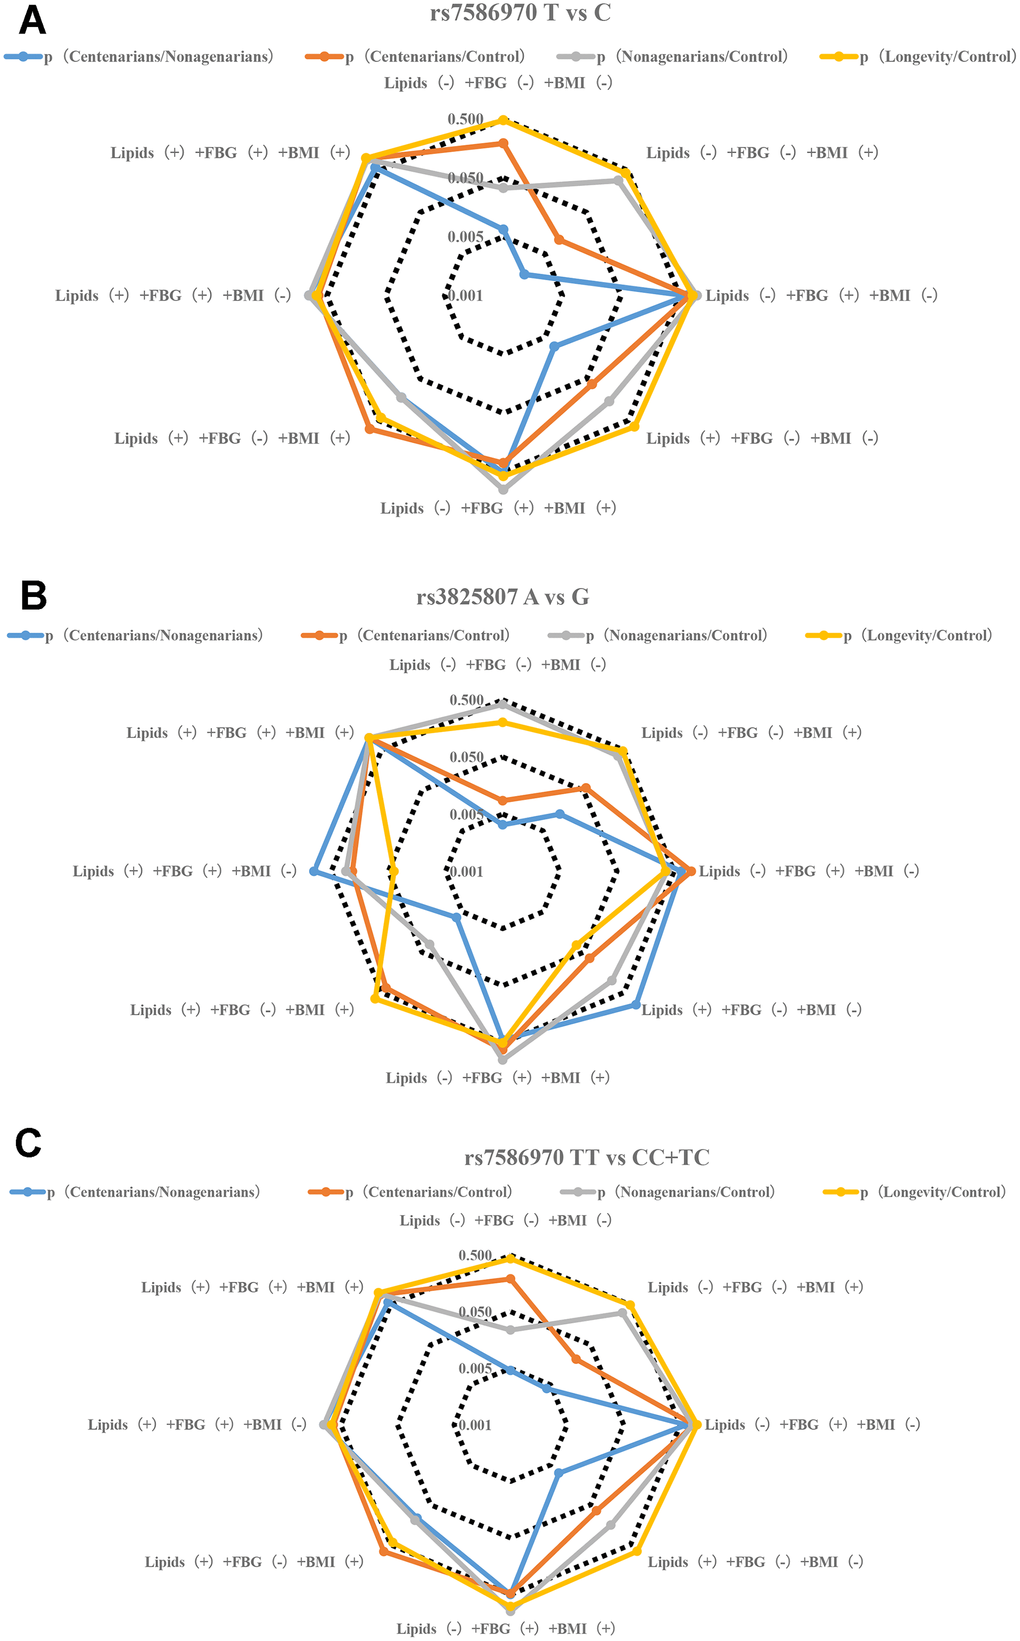
Figure 2.Stratification analysis of metabolic phenotype of TFPI rs7586970 and ADAMTS7 rs3825807. (A) Correlation analysis of allele frequency of TFPI rs7586970 with metabolic phenotype. The frequency of the rs7586970 T is specifically correlated with the metabolic level of lipids (-) +FBG (-) +BMI (+) in centenarians. The allele frequency of rs7586970 T was significantly increased in the centenarians group. (B) Correlation analysis of allele frequency of ADAMTS7 rs3825807 with metabolic phenotype. The frequency of the rs3825807 A is specifically correlated with the metabolic level of lipids (-) +FBG (-) +BMI (-) in centenarians. (C) Correlation analysis of genotype frequency of TFPI rs7586970 with metabolic phenotype. The rs7586970 recessive model (TT/TC+CC) showed a specific correlation with lipids (-) +FBG (-) +BMI (+) in centenarians.
(D) Correlation analysis of genotype frequency of ADAMTS7 rs3825807 with metabolic phenotype. The rs3825807 recessive model (AA/AG+GG) showed a specific correlation with lipids (-) +FBG (-) + BMI (-/+) in centenarians. (E) Correlation analysis between the interaction of TFPI rs7586970 and ADAMTS7 rs3825807 with metabolic phenotype. TTAA has a specific and significant correlation with lipids (-) +FBG (-) +BMI (-) in centenarians. (F) Correlation analysis between the interaction of TFPI rs7586970 and APOE ε3 with metabolic phenotype. TTε3ε3 was specifically correlated with lipids (-) +FBG (-) +BMI (+) in centenarians.
(G) Correlation analysis between the interaction of ADAMTS7 rs3825807 and APOE ε3 with metabolic phenotype. AAε3ε3 was not specifically correlated with BMI, blood glucose and lipid in centenarians. (H) Correlation analysis between interaction of TFPI rs7586970, ADAMTS7 rs3825807 and APOE ε3 with metabolic phenotype. AATTε3ε3 in the centenarians group showed a specific correlation with lipids (-) +FBG (-) +BMI (-).