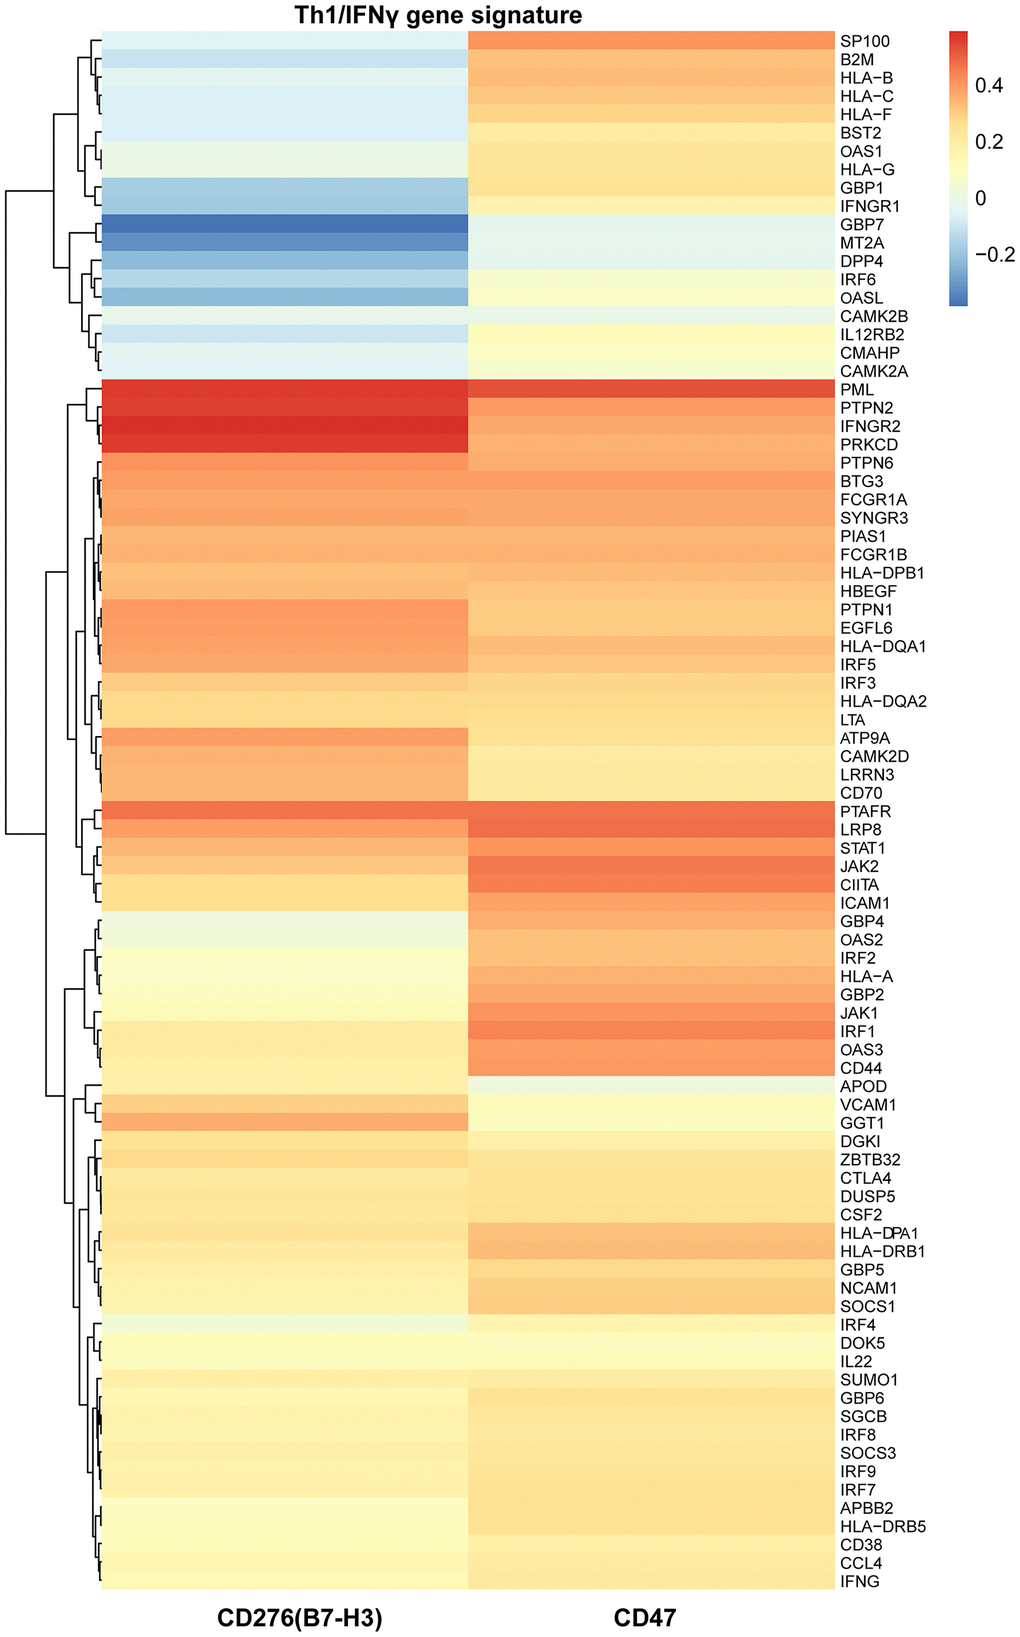
Figure 4.The relationships of B7-H3 and CD47 with Th1/IFNγ gene signature in TCGA-LIHC cohort. Heat map shows the correlations of each gene expression of Th1/IFNγ gene signature with B7-H3 and CD47 expression, which were computed based on 345 HCC cases. Red color indicates positive Pearson correlation coefficients; blue color indicates negative correlations.