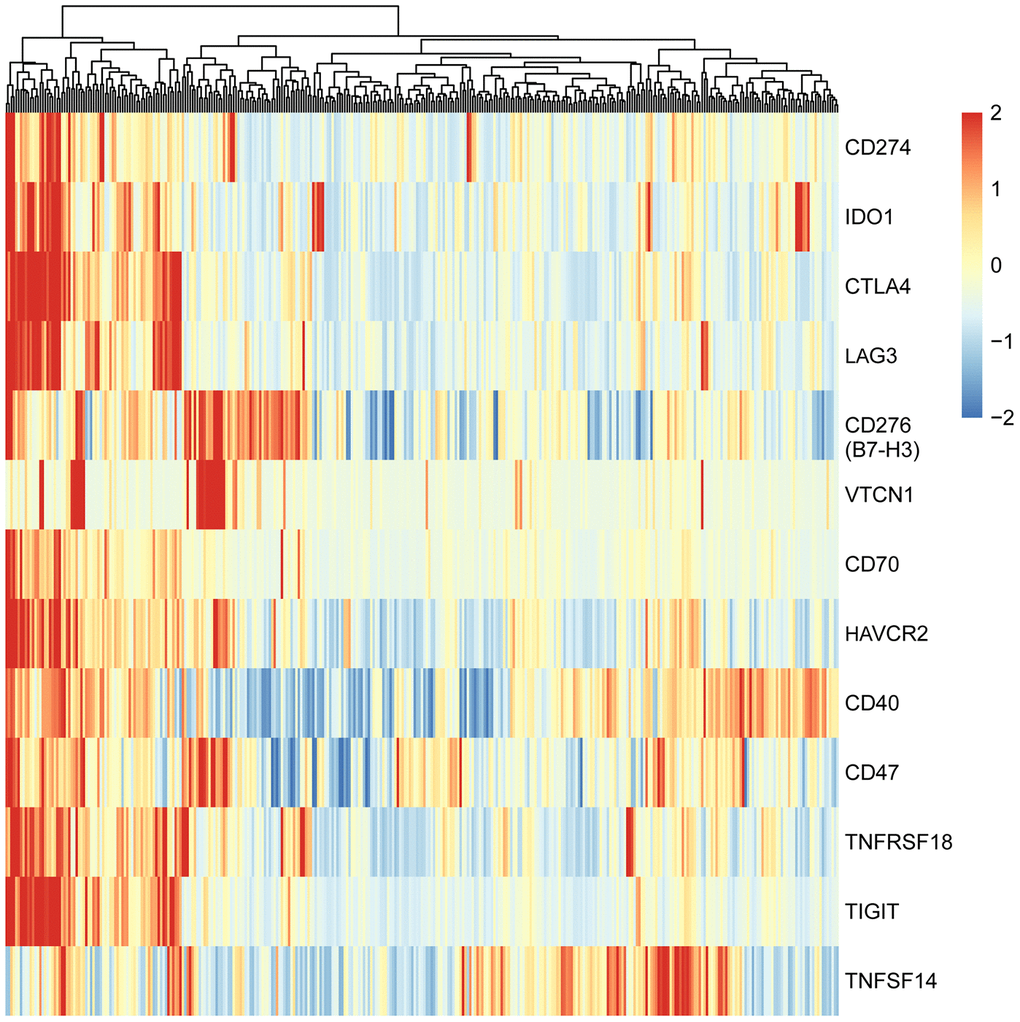
Figure 1.Heatmap of adaptive immune resistance genes in HCC patients of TCGA-LIHC cohort. The data were downloaded from TCGA-LIHC dataset and analyzed with clustering method. All HCC patients (374 cases) were clustered into two groups: one (73 cases) was characterized by high-expression of nearly all adaptive immune resistance genes, and the other (301 cases) by low-expression of the genes. Red bar represents gene high expression, and green represents gene low expression. Each column indicates one sample.