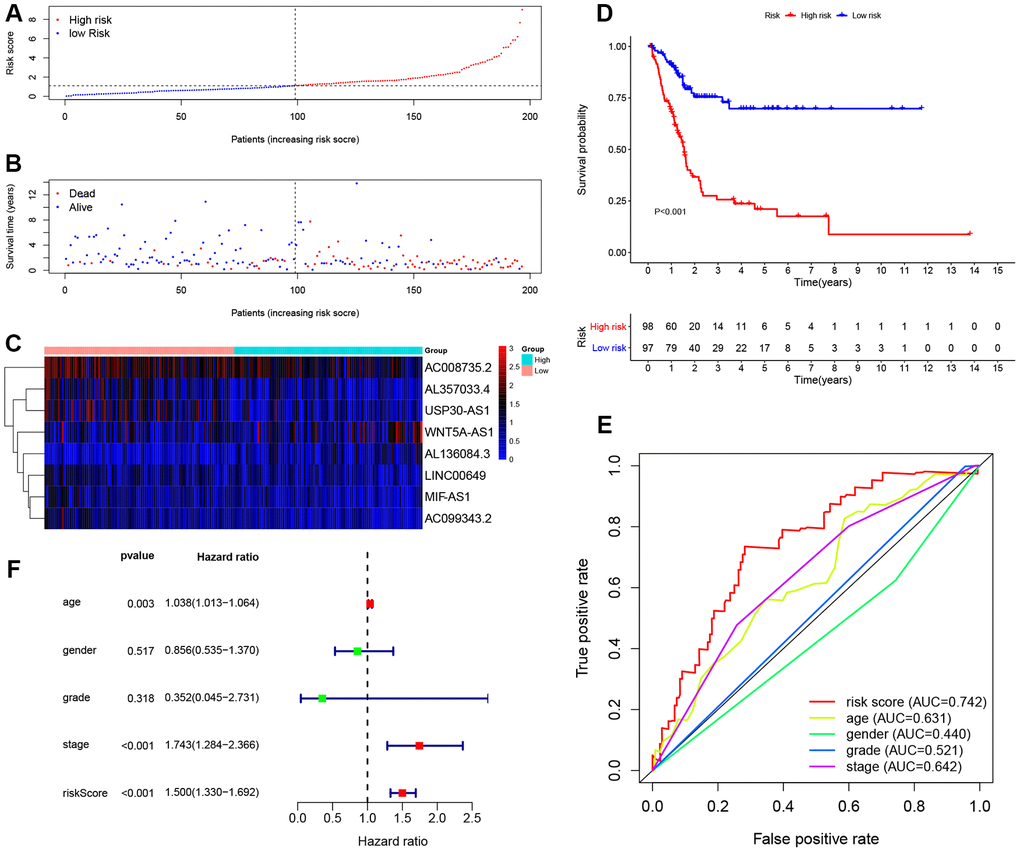
Figure 4.Evaluating the predictive power of the 8-lncRNA immune-related signature in the training cohort. (A–C) Distribution of risk score, survival status, and lncRNA expression of patients in the training cohort; (D) Kaplan-Meier survival curve of the high-risk and low-risk groups in the training cohort; (E) Time-dependent ROC (receiver operating characteristic) curves and AUC (area under curve) based on the training cohort for 5-year overall survival; (F) Forest plot for multivariate Cox regression analysis.