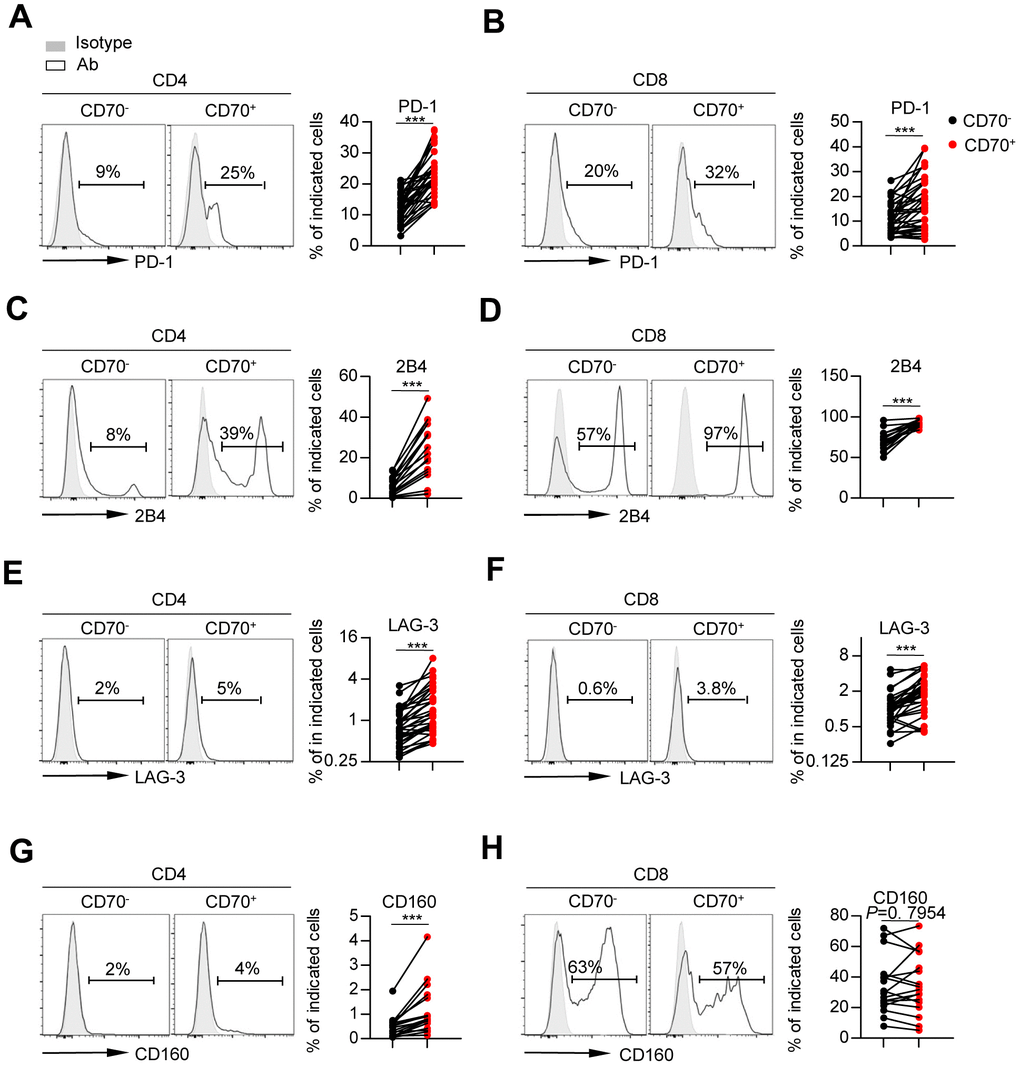
Figure 4.CD70 expression is associated with the phenotypic profile of exhaustion. Flow cytometry analysis of expression of PD-1 (A–B), 2B4 (C–D), LAG-3 (E–F) and CD160 (G–H) on CD70- vs. CD70+ CD4+ and CD8+ T cells from elderly individuals (61-80 years, n = 17 [2B4, CD160], n = 34 [PD-1, LAG-3]). Representative histograms (left) and plots (right) display the expression of the above receptors on CD70- vs. CD70+ cells (gated with CD4+ or CD8+ T cells). The p-values were obtained by paired t-test (PD-1 [CD4+ T cells], 2B4, CD160 [CD8+ T cells]) or Wilcoxon matched-pairs signed rank test (PD-1 [CD8+ T cells], LAG-3, CD160 [CD4+ T cells]). ***p < 0.001.