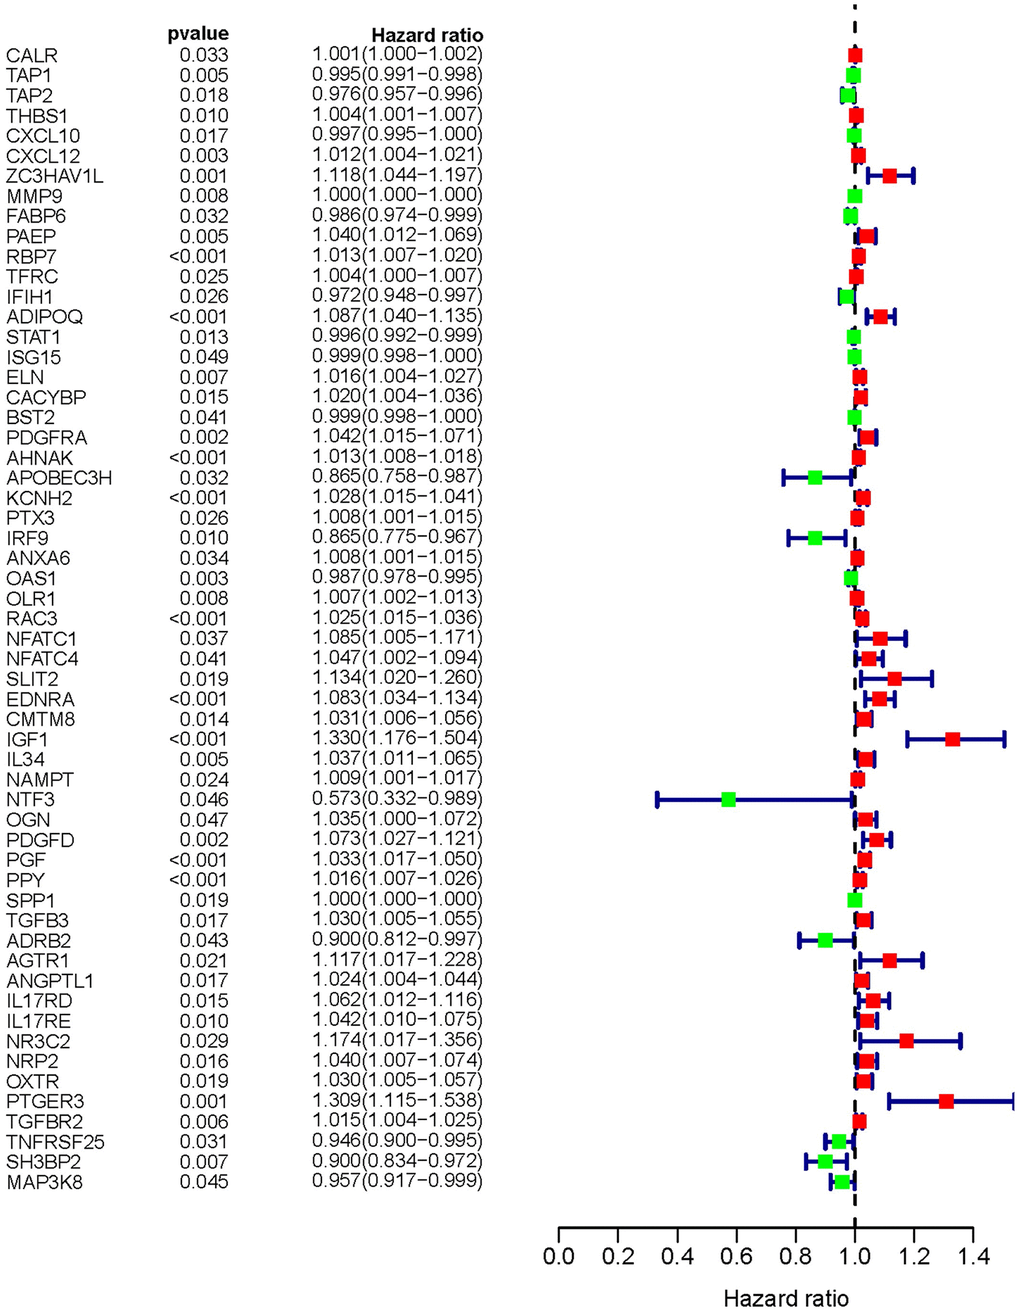
Figure 3.Survival-related values of sIFRGs. Forest plot of the hazard ratios showing the survival-related values of sIFRGs. Red parts represent upregulated sIFRGs, and green parts represent downregulated sIFRGs.
Figure 3 — Establishment of a novel risk score model by comprehensively analyzing the immunogen database of bladder cancer to indicate clinical significance and predict prognosis | Aging