Submit an Article
Navigate
Home
Editorial Board
Editorial Policies
Current Volume
Archive
Scientific Integrity
Publication Ethics Statements
Interviews with Outstanding Authors
Newsroom
Sponsored Conferences
Podcast
Contact
Special Collections
Submit an Article
Online ISSN: 1945-4589
Research Paper
|
Volume 12, Issue 12
|
pp. 11914–11941
Serum metabolites associate with physical performance among middle-aged adults: Evidence from the Bogalusa Heart Study
Back to article
Figure 4
(4 of 4)
−
100%
+
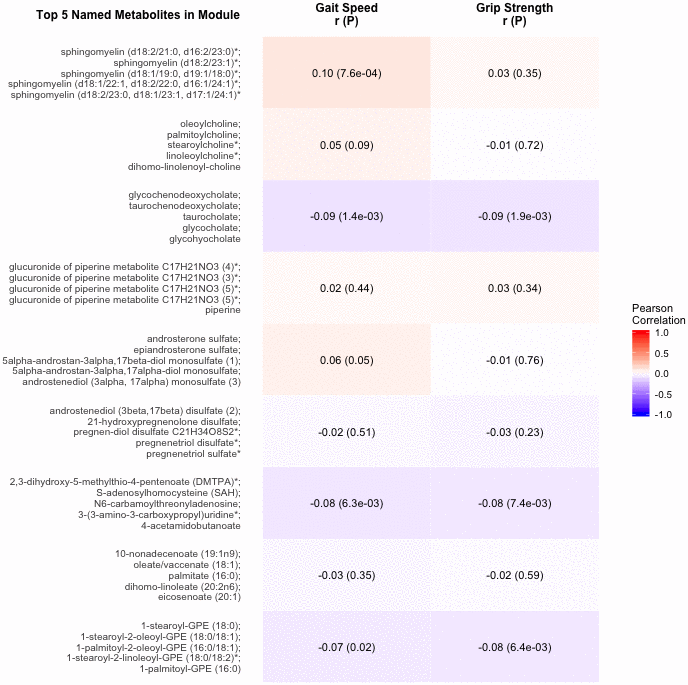
Figure 4.
Correlations of metabolite modules with physical performance.
Colors represent correlation strength, ranging from blue (-1) to red (1). * indicates compounds with Metabolomics Standards Initiative confidence level 2.