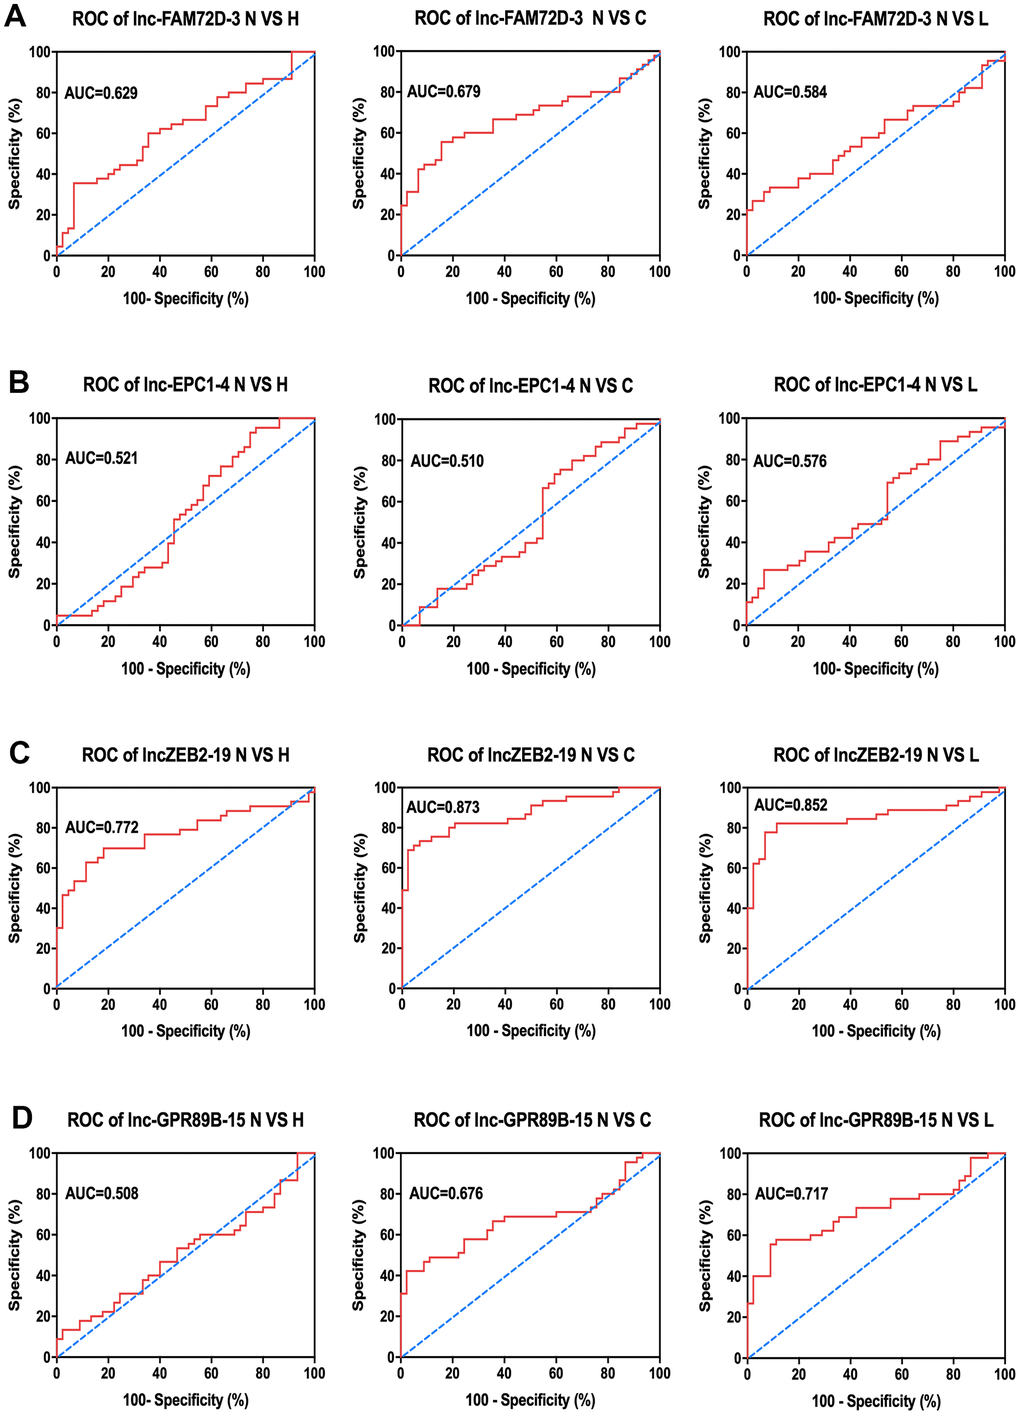
Figure 5.Clinical analysis of AUC of (A) lnc-FAM72D-3, (B) lnc-EPC1-4, (C) lnc-ZEB2-19, and (D) lnc-GPR89B-15 in the control group compared to hepatitis, cirrhosis, and HCC groups. N VS H, normal versus hepatitis; N VS C, normal versus cirrhosis; N VS L, normal versus HCC; AUC, area under the curve; ROC, receiver operating characteristic; HCC, hepatocellular carcinoma.