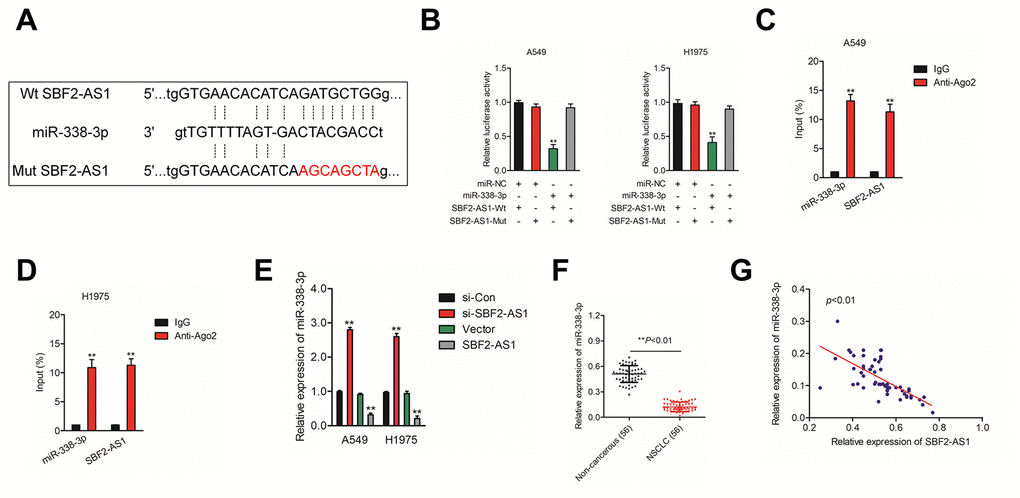
Figure 3.SBF2-AS1 negatively regulates miR-338-3p expression. (A) Graphical representation of the potential binding sites between SBF2-AS1 and miR-338-3p. (B) The relative luciferase activity in A549 or H1975 cell transfected with pmirGLO carrying SBF2-AS1-Wt or SBF2-AS1-Mut was tested. **P<0.01 compared with miR-NC + SBF2-AS1-Wt. (C–D) RIP assay was performed to determine the association between SBF2-AS1 and miR-338-3p in A549 and H1975 cell. **P<0.01 compared with IgG. (E) miR-338-3p expression level in A549 and H1975 cell transfected with SBF2-AS1 or si-SBF2-AS1 was shown. **P<0.01 compared with si-Con or Vector. (F) miR-338-3p expression in NSCLC tissues were quantified by qRT- PCR analysis. **P<0.01 compared with non-cancerous. (G) The negative correlation between SBF2-AS1 and miR-338-3p was displayed by Pearson’s correlation curve.