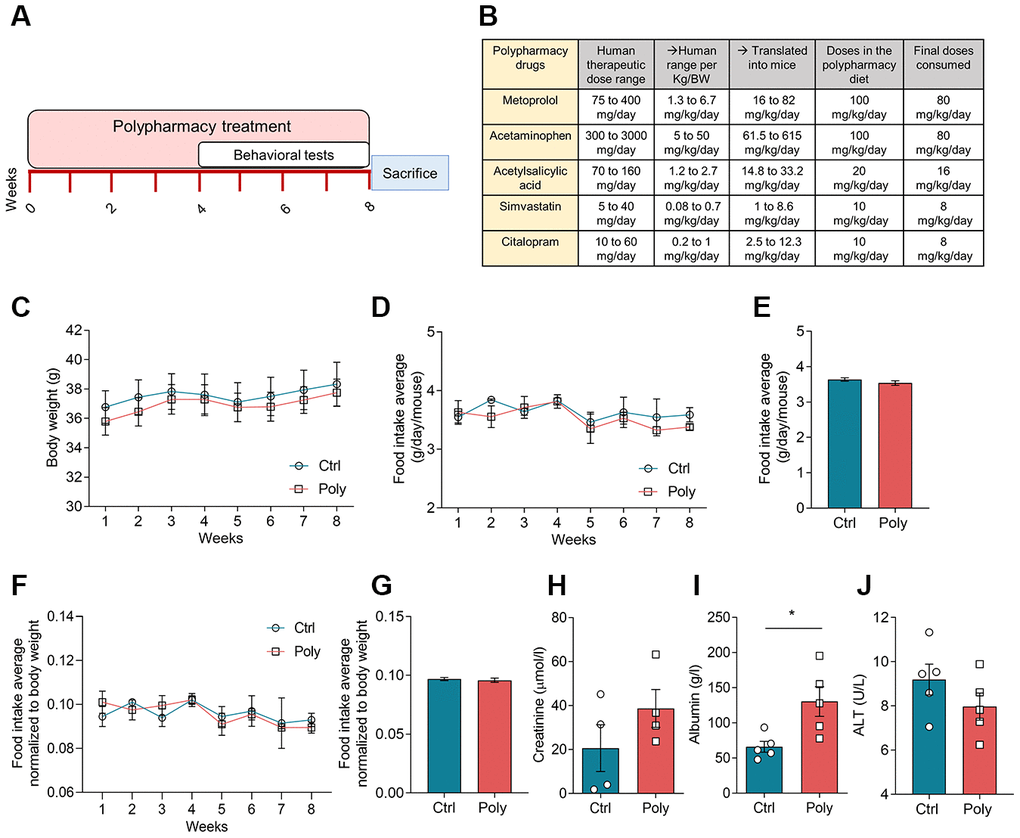
Figure 1.Effects of polypharmacy treatment on body weight and food intake, and serum protein levels. (A) The diagram above outlines the timeline of the polypharmacy study. (B) The table indicates the composition of the polypharmacy diet and drug dosages, specifying the human therapeutic range per person and per Kg/body weight (BW) and translated into mice. (C) The curves show mouse body weight average monitored over the eight weeks of treatment. (D–G) The curve and histogram plots express the FI as weekly and total average over the study period, measured as real values (D, E) or normalized to body weight (F, G). Animals per group: n= 9 control group, n= 10 polypharmacy group. (H–J) Histograms indicate serum creatinine, albumin and ALT levels; creatinine: n= 4, 4; albumin: n= 5, 5: ALT: n= 5, 5, for control and polypharmacy groups respectively; *p<0.05, Mann-Whitney test. All data are presented as mean ± SEM. Ctrl= control, Poly= polypharmacy.