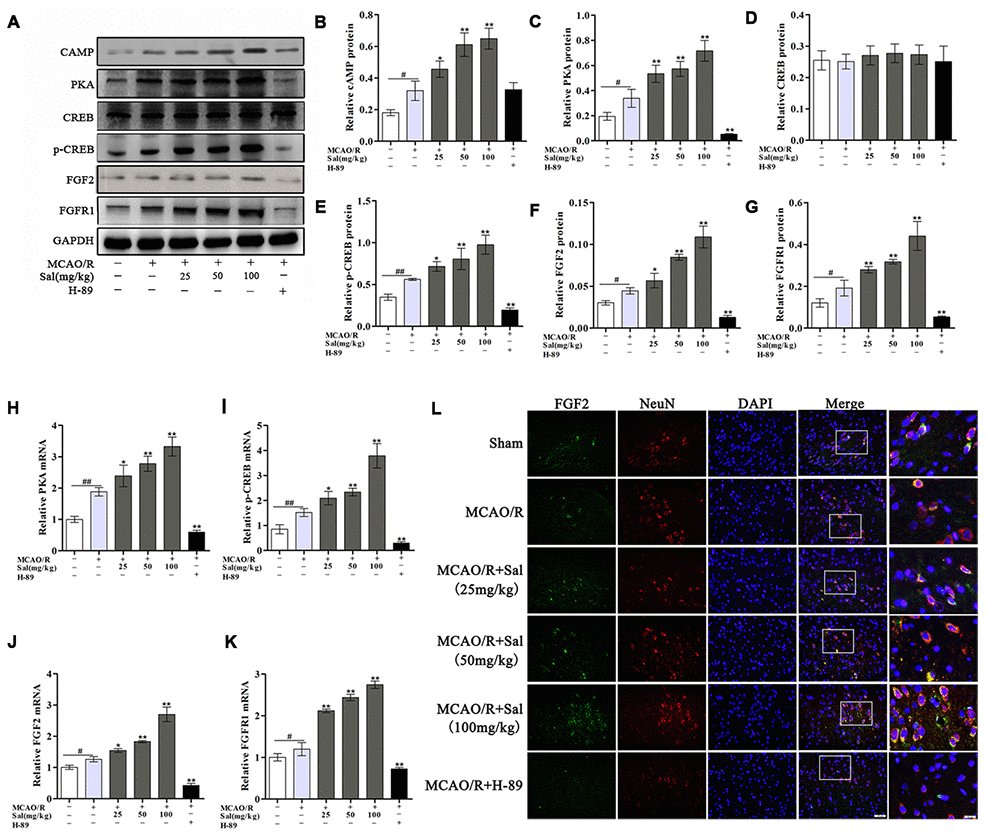
Figure 6.Sal upregulates the FGF2-mediated cAMP/PKA/CREB signaling pathway following MCAO/R. (A–G) Representative western blot bands of cAMP, PKA, CREB, p-CREB, FGF2 and FGFR1 in each group. (H–K) QPCR analysis of PKA, p-CREB, FGF2 and FGFR1 mRNA expression at 7 days after MCAO/R in different groups. (I) Double staining for FGF2-positive (green) and NeuN-positive neurons (red) neurons (the scale bars are 20 μm and 10 μm). Values are expressed as the mean ± SD. #p < 0.05, ##p < 0.01 vs. sham; *p < 0.05, **p < 0.01 vs. MCAO/R.