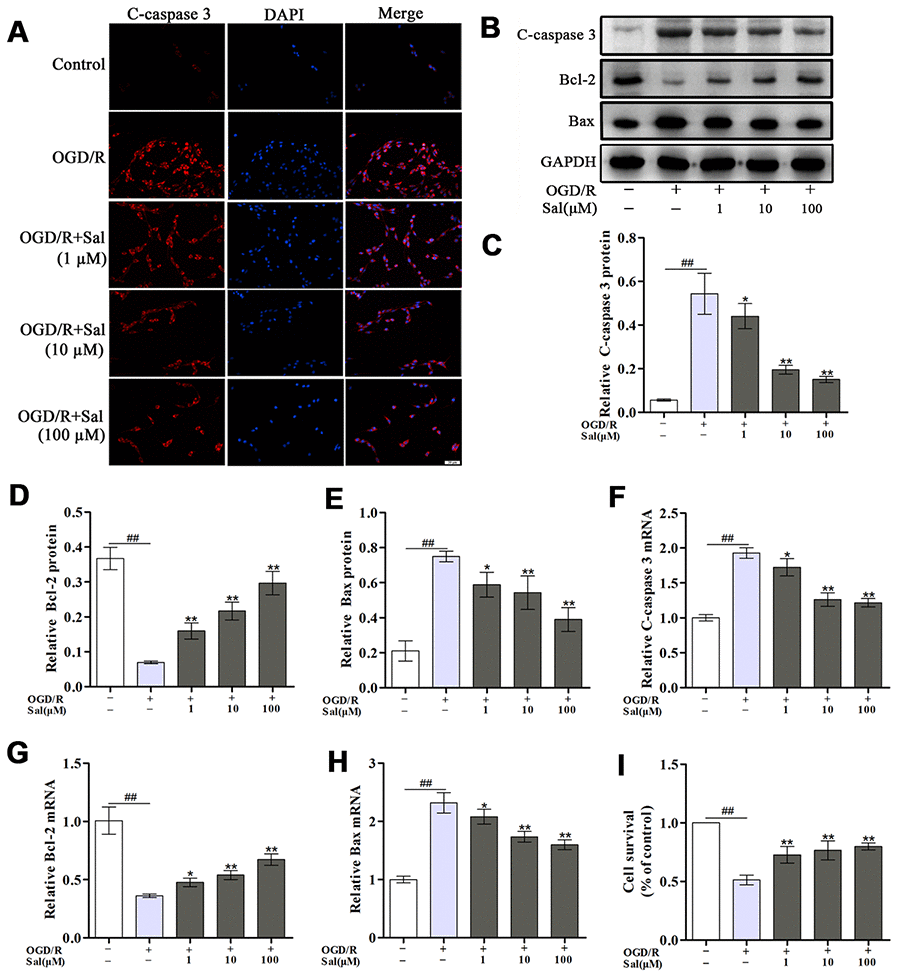
Figure 3.Sal prevents OGD/R-induced neuronal apoptosis. (A) Immunofluorescence staining of c-caspase 3 (the scale bar is 20 μm). (B–E) Representative western blot bands and protein expression of c-caspase 3, Bcl-2 and Bax in each group. (F–H) QPCR data showing the mRNA expression levels of c-caspase 3, Bcl-2 and Bax. (I) The CCK-8 assay was performed to assess cell proliferation. Values are expressed as the mean ± SD. #p < 0.05, ##p < 0.01 vs. control; *p < 0.05, **p < 0.01 vs. OGD/R.