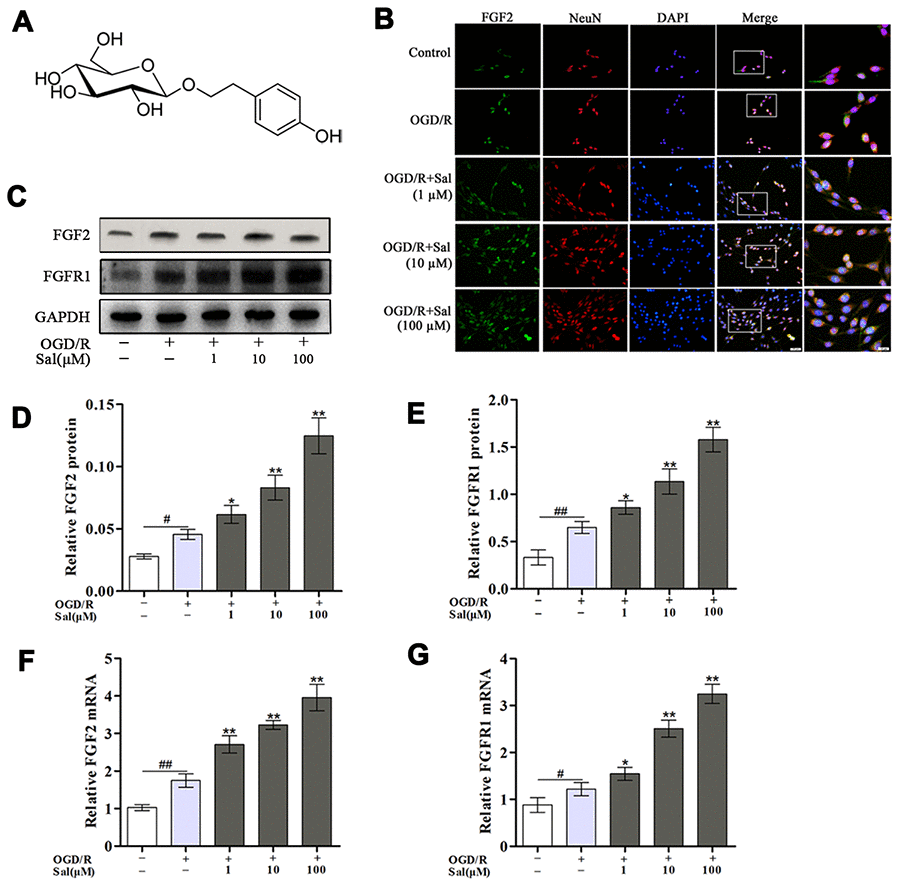
Figure 1.Sal increases FGF2 and FGFR1 expression in PC12 cells after OGD/R. (A) The chemical structure of Sal. (B) Double staining for FGF2-positive (green) and NeuN-positive (red) neurons (scale bars are 20 μm and 10 μm). (C–E) Representative western blot bands and protein expression of FGF2 and FGFR1 in PC12 cells. GAPDH was used as a protein loading control and for band density normalization. (F, G) The mRNA expression levels of FGF2 and FGFR1. Values are expressed as the mean ± SD. #p < 0.05, ##p < 0.01 vs. control; *p < 0.05, **p < 0.01 vs. OGD/R.