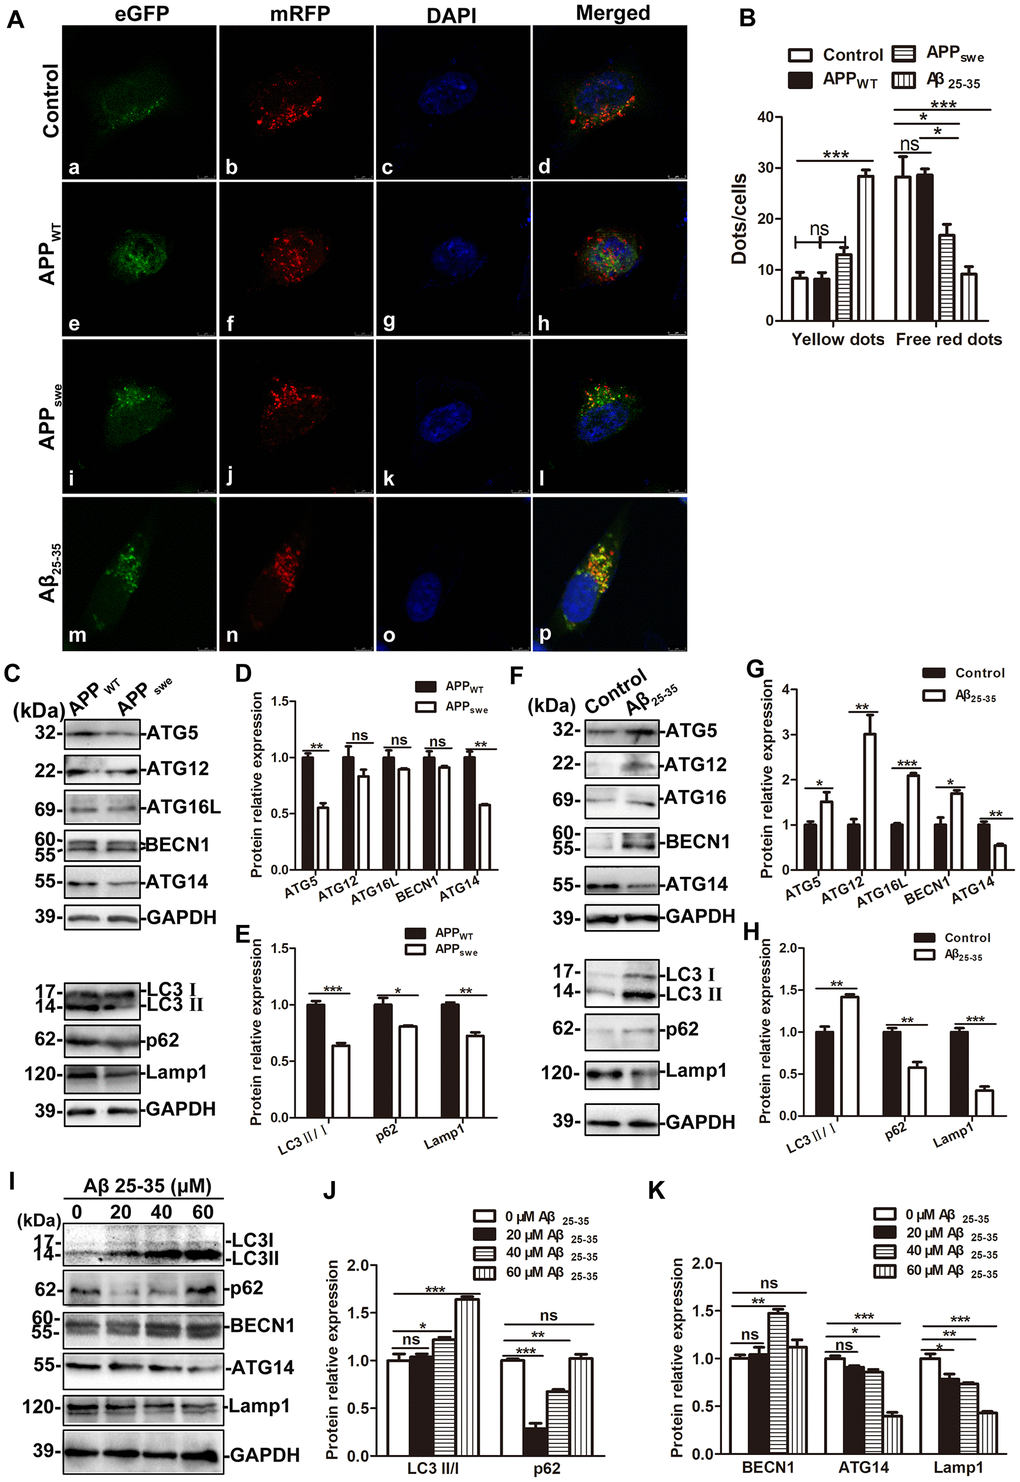
Figure 7.The effects of exogenous Aβ 25-35 treatment and endogenous overexpression of APPswe on autophagic flux. (A) Fluorescence microscopy images of control SH-SY5Y, APPWT, APPswe and SH-SY5Y +Aβ 25-35 (30 μM) cells infected with mRFP-GFP-LC3 adenovirus for 24 h and then treated with 100 nM rapamycin for 10 min (scale bar, 10 μm). (B) mRFP and GFP puncta were quantified to determine the number of APs and ALs per cell. For each group, 30 cells from 5 visual fields were randomly selected for counting (*P < 0.05, **P < 0.01, ***P < 0.001). (C) Western blot showing the expression of ATG5, ATG12, ATG16L, BECN1, ATG14, LC3, p62 and Lamp1 in APPWT and APPswe cells. (D and E) Relative protein gray density analysis. (F) Western blot analysis showing the expression of ATG5, ATG12, ATG16L, BECN1, ATG14, LC3, p62 and Lamp1 in SH-SY5Y and SH-SY5Y +Aβ 25-35 (30 μM) cells. (G and H) Protein band relative gray density analysis. (I) Different concentrations of Aβ 25-35 (0, 20, 40, and 60 μM) were used to treat SH-SY5Y cells for 24 h and the expression of LC3, p62, BECN1, ATG14 and Lamp1 were assessed by Western blot. (J and K) Relative protein gray density analysis. (* P < 0.05, ** P < 0.01, *** P < 0.001; “ns” denotes that there was no significant difference, n = 3).