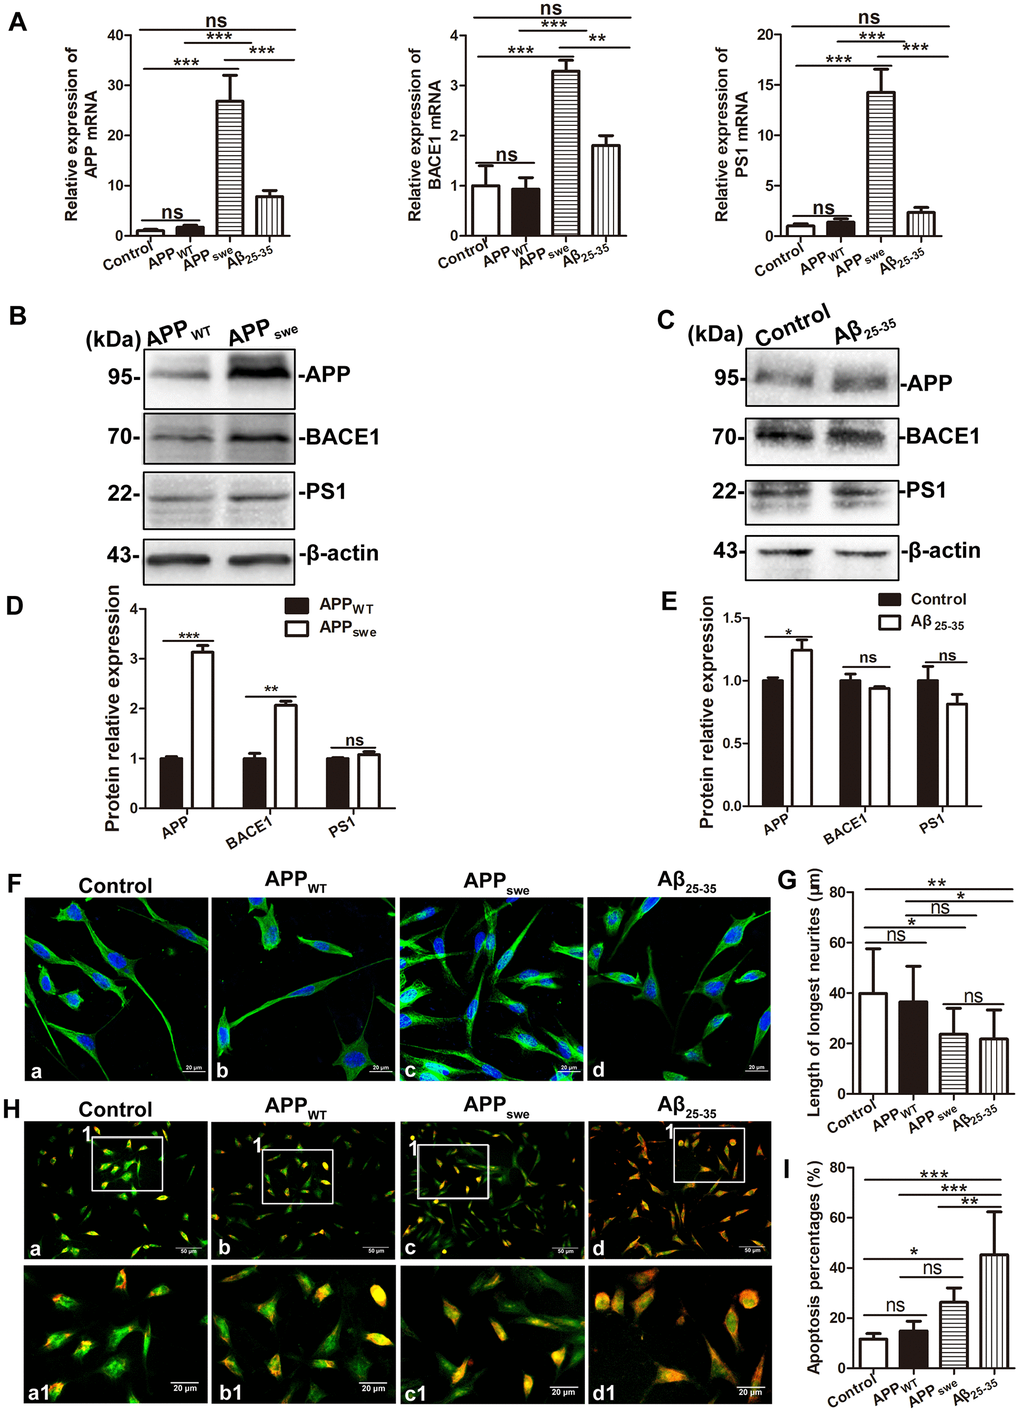
Figure 6.Comparison of SH-SY5Y cells (Control), SH-SY5Y cells transfected with empty vector (APPWT), APPswe-overexpressing SH-SY5Y cells (APPswe) and SH-SY5Y cells treated with 30 μM Aβ25-35 (SH-SY5Y +Aβ 25-35). (A) Real-time PCR assay showing the expression of APP, BACE1 and PS1 mRNA in the four group cells. (B and C) Western blot showing the expression of APP, BACE1 and PS1 in APPWT and APPswe cells, SH-SY5Y cells and SH-SY5Y +Aβ 25-35 cells. (D and E) Relative protein gray density analysis. (F) Tubulin staining showing the morphology of the four group cells. Scale bar = 20 μm. (G) Statistical analysis of the longest processes. (H) Acridine orange staining showing membrane stability of the four group cells. a –c: Scale bar = 50 μm, a1 – c1: Scale bar = 20 μm. (I) Statistical analysis of the apoptosis rate. (* P < 0.05, ** P < 0.01, *** P < 0.001; “ns” denotes that there was no significant difference, n=3).