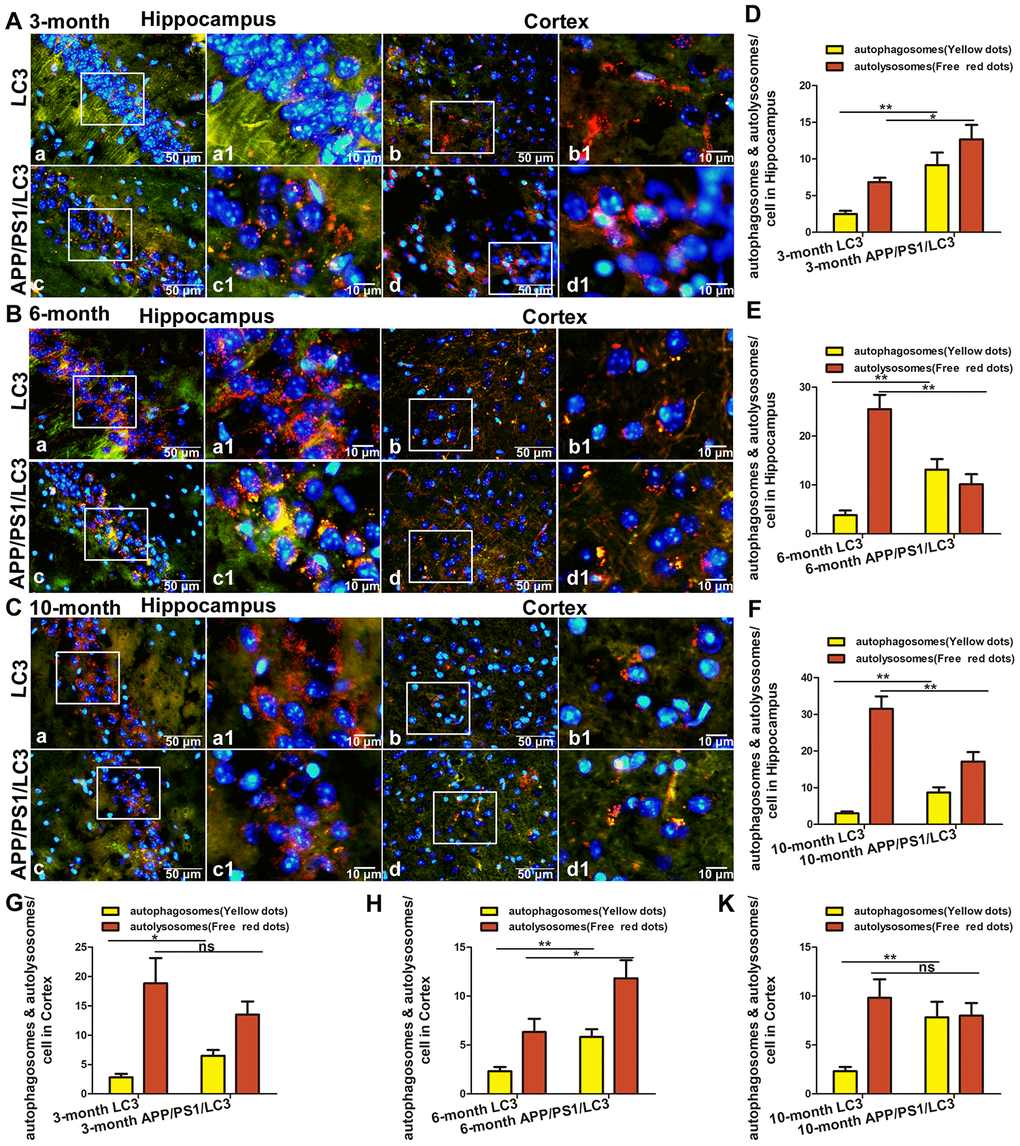
Figure 5.The expression of AP and AL in the brains of APP/PS1/LC3 autophagic flux AD model mice. (A–C) The APs and ALs in the hippocampus and cortex of 3, 6, 10 -month-old LC3 and 3×Tg mice. Scale bar: a-d, 50 μm, a1-d1, 10 μm, a and c: hippocampus, b and d: cortex, a1-d1 are partial magnifications of a-d. (D–K) The number of mRFP and GFP spots in 30 cells from 5 high-power fields was counted. The yellow dots of mRFP and GFP colocalization represent APs, and the free red dots represent ALs. (Compared with LC3 mice, *P<0.05, **P<0.01, ***P<0.001; “ns” denotes that there was no significant difference, n = 3).