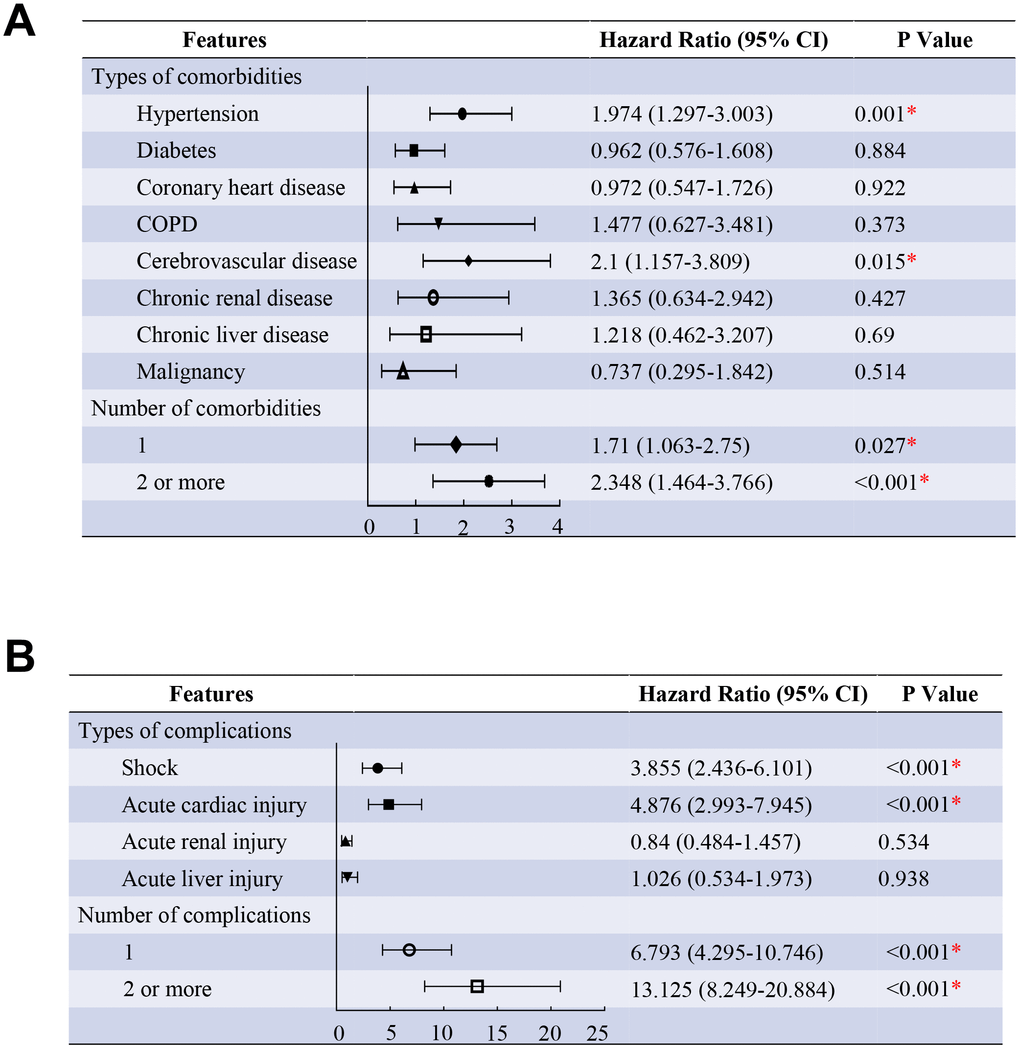
Figure 2.Predictors of the death in the proportional hazards model. (A) Shown in the figure are the hazards ratio (HR) and the 95% confidence interval (95%CI) for the risk factors of death after disease onset. The comorbidities were classified according to the organ systems as well as the number. (B), Shown in the figure are the hazards ratio (HR) and the 95% confidence interval (95%CI) for the risk factors of death after disease onset. The complications were classified according to the organ systems as well as the number. * means the P value <0.05. The scale bar indicates the HR. The model has been adjusted with age groups.