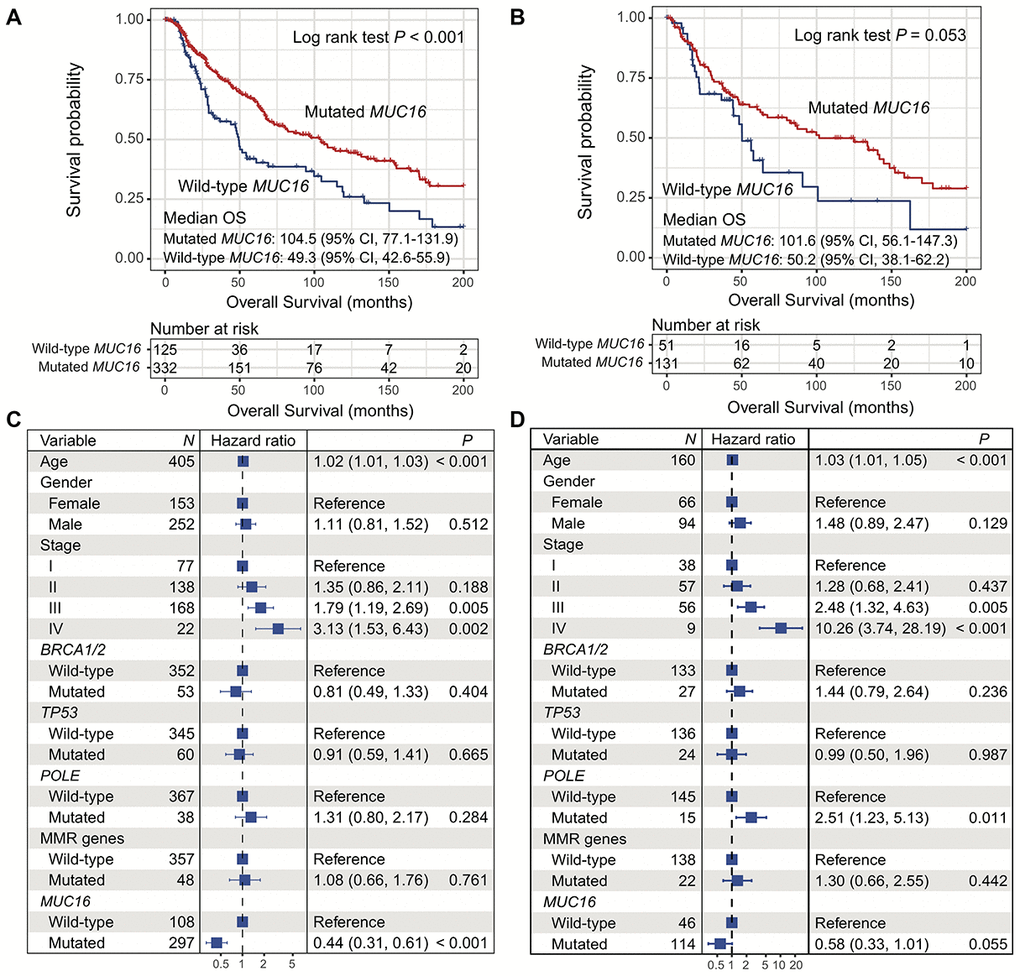
Figure 4.Correlation of MUC16 mutations with overall survival in 2 cohorts. (A, B) Kaplan-Meier survival analysis based on MUC16 mutational status (left: TCGA; right: ICGC). (C, D) Forest plot representation of association of MUC16 mutations with prognosis (left: TCGA; right: ICGC).