Submit an Article
Navigate
Home
Editorial Board
Editorial Policies
Current Volume
Archive
Scientific Integrity
Publication Ethics Statements
Interviews with Outstanding Authors
Newsroom
Sponsored Conferences
Podcast
Contact
Special Collections
Submit an Article
Online ISSN: 1945-4589
Research Paper
|
Volume 12, Issue 11
|
pp. 10795–10808
Association of gut microbiota composition and function with an aged rat model of senile osteoporosis using 16S rRNA and metagenomic sequencing analysis
Back to article
Figure 5
(5 of 8)
−
100%
+
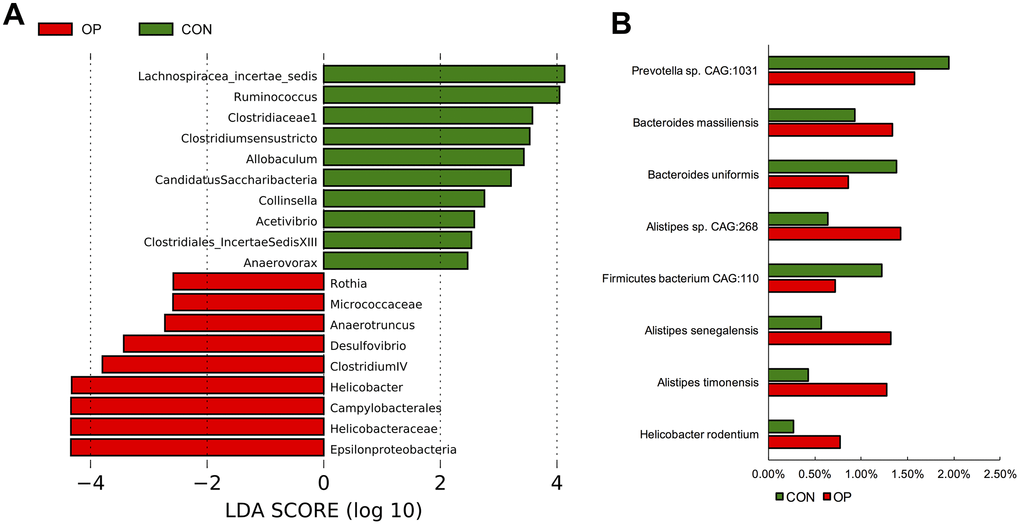
Figure 5.
LDA Effect Size at the phylum level of the each group (
A
). The significant differences of species abundance between both groups at species level (
B
).