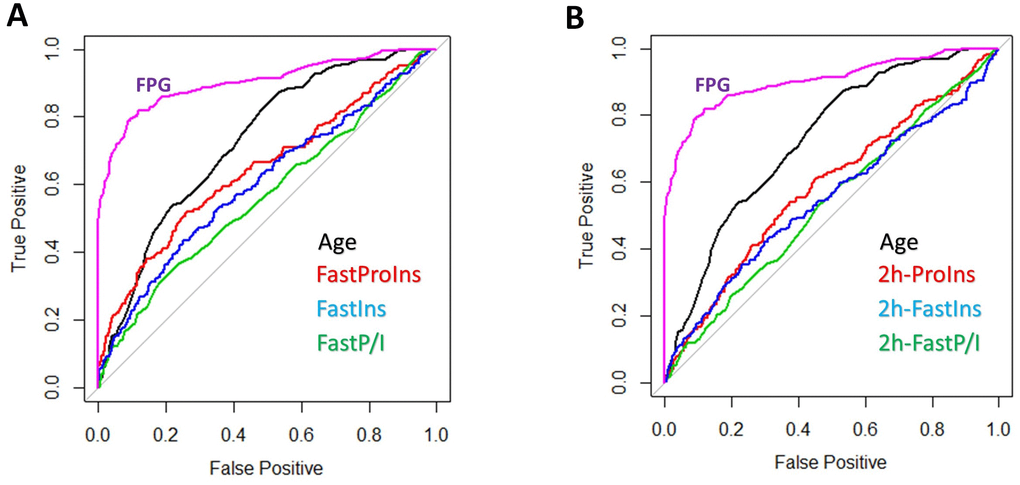
Figure 6.Prediction power of proinsulin, insulin levels and proinsulin to insulin (P/I) ratio for diabetes. (A) Weak prediction power of proinsulin, insulin levels and P/I ratio as compared to age and HbA1c. Data from 1579 individuals were plotted with pROC package in R. HbA1c was one of the three parameters used to define diabetes, therefore a strong predictor (curve to the upper left corner). The diagonal line means no prediction power. All proinsulin, insulin levels and P/I ratio were weaker than age in predicting diabetes and P/I ratio was the worse. (B) Weak prediction power of postprandial proinsulin, insulin levels and P/I ratio as compared to age and HbA1c. All proinsulin, insulin levels and P/I ratio after 2-hour glucose stimulation were weaker than age in predicting diabetes and P/I ratio was the worse.