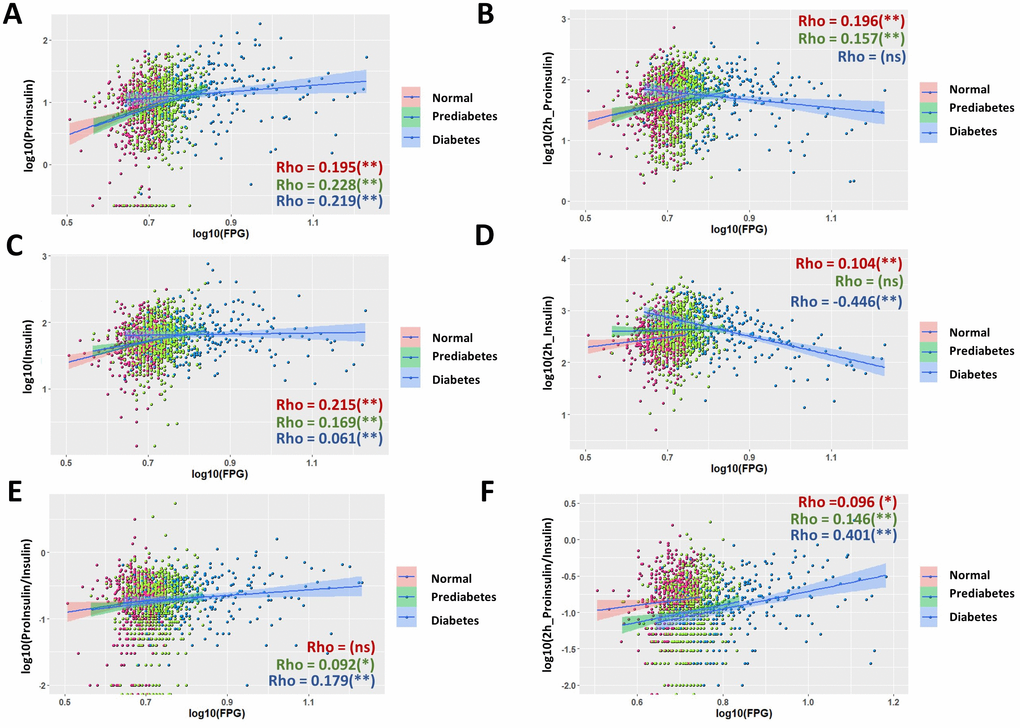
Figure 2.Nonuniform correlations of proinsulin, insulin and P/I ratio with fasting plasma glucose (FPG) in normal, prediabetic and diabetes population. (A) Correlation of fasting proinsulin levels with FPG in normal, prediabetic and diabetes populations. Data from 1579 participants were log transformed, scatter plotted and linear modeled by using R language for each subgroup (normal in red, prediabetes in green and diabetes in blue). Association strength was evaluated by Spearman's association coefficient (Rho) using SPSS software, with absolute Rho < 0.3 considered weak, 0.3≤Rho<0.6 moderate and Rho≥0.6 strong association; ns, not significant. Shaded line, linear regression with 95% of confidence interval (CI). (B) Distinct correlation of proinsulin levels after 2hOGTT to FPG levels in normal, prediabetic and diabetic groups. (C) Correlation of fasting insulin levels with fasting plasma glucose (FPG) in normal, prediabetic and diabetes populations. (D) Opposite correlation of 2h OGTT insulin levels to FPG levels in normal and diabetes subgroups. In diabetes, 2h OGTT insulin levels has negative correlation to FPG with moderate association strength (Rho = -0.446). (E, F) The strength of association (Rho) of P/I ratio were different among normal, prediabetic and diabetic groups. In diabetes, 2h OGTT P/I ratio has positive correlation to FPG with moderate association strength (Rho = 0.401).