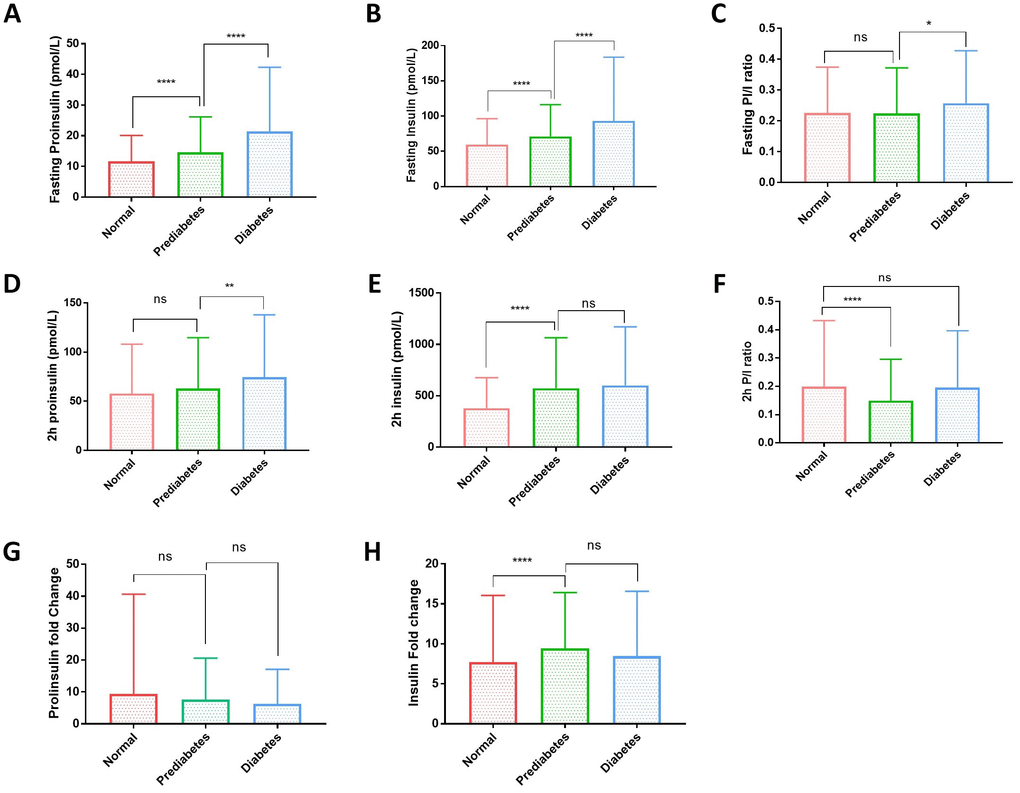
Figure 1.Plasma proinsulin, insulin levels and proinsulin to insulin (P/I) ratio in normal, prediabetic and diabetic groups. (A) Fasting proinsulin levels graduately increased from normal to prediabetic and diabetes population. A cohort of 1579 participants were grouped to normal, prediabetes and diabetes according to the standard set by American Diabetes Association: diabetes, fasting plasma glucose (FPG) ≥7.0 mmol/L or oral glucose tolerance test (OGTT) with 2-hour plasma glucose (2hPG) ≥11.1 mmol/L or HbA1c ≥6.5%; prediabetes, 5.6mmol/L≤FPG<7.0 mmol/L or 7.8mmol/L≤2hPG<11.1mmol/L or 5.7%≤HbA1C<6.4%; otherwise normal. Error bars: standard deviation. Student’s t-test: ****, P<0.0001. (B) Fasting insulin levels graduately increased from normal to prediabetic and diabetes population. Participants were grouped and data were analyzed as in (A). Student’s t-test: ****, P<0.0001. (C) Fasting proinsulin to insulin ratio (P/I ratio) had no difference between normal andes groups and only slight increase in diabetic group. Participants were grouped and data analyzed as in (A). Student’s t-test: *, P<0.05; ns, not significant. (D) Proinsulin levels after 2-hour glucose stimulation in an oral glucose tolerance test (2hOGTT) were significantly elevated in diabetes but not prediabetic groups. Student’s t-test: **, P<0.01; ns, not significant. (E) Insulin levels after 2-hour glucose stimulation in an OGTT were significantly elevated in prediabetic group but did not further increase in diabetic group. Student’s t-test: **, P<0.01; ns, not significant. (F) After 2hOGTT, proinsulin to insulin ratio (P/I ratio) had no difference between normal and diabetic groups but was significantly lower in prediabetic group. Student’s t-test: ****, P<0.0001; ns, not significant. (G) 2-hour glucose stimulation did not increase proinsulin levels in prediabetic and diabetic groups. Student’s t-test: ns, not significant. (H) 2-hour glucose stimulation increased Insulin levels in prediabetic group but did not further increase in diabetic group. Student’s t-test: ****, P<0.0001; ns, not significant.