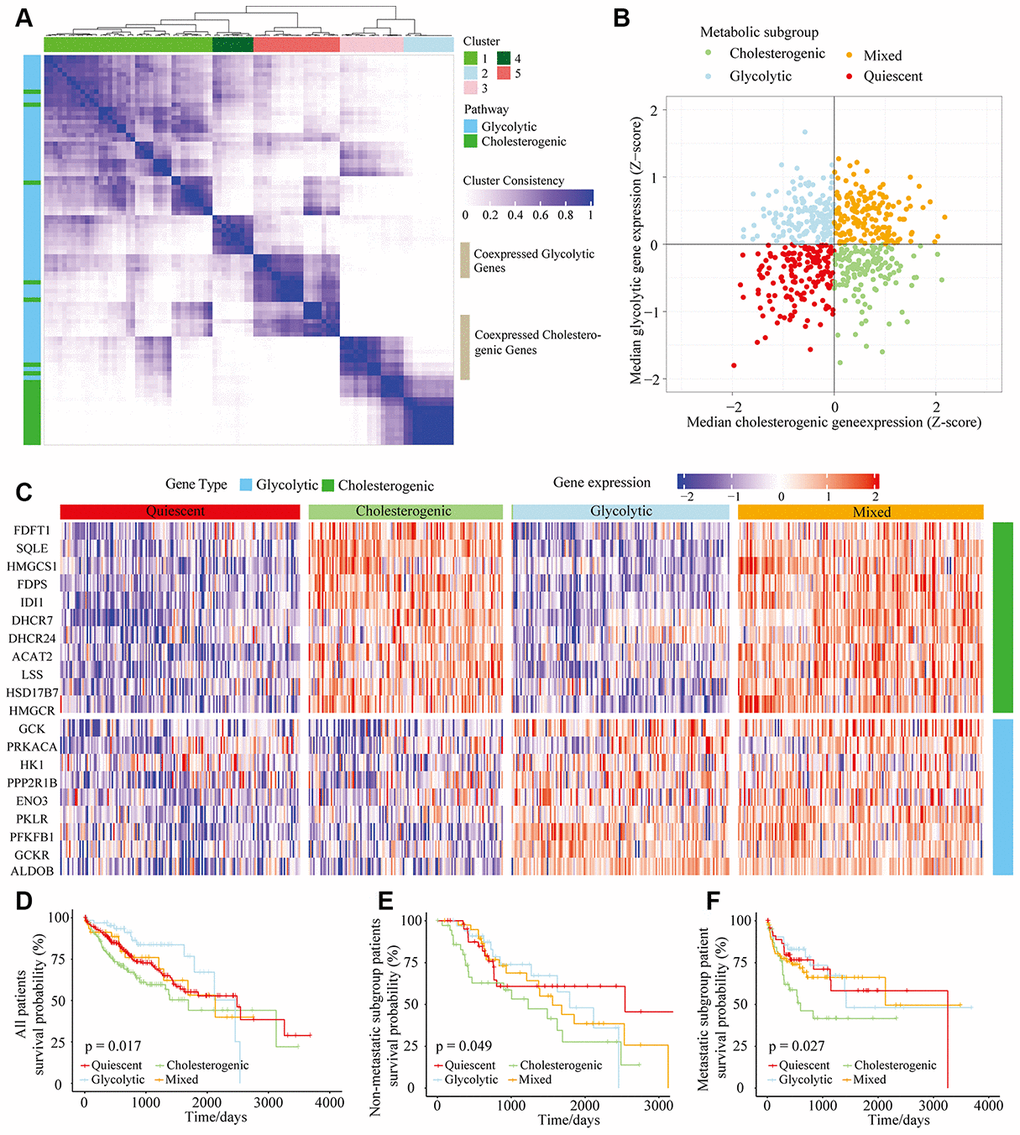
Figure 1.The metabolic gene landscape of HCC based on glycolytic and cholesterogenic clusters. (A) Heat map of consensus clustering (k=5) for glycolytic and cholesterogenic genes in resected and metastatic LIHC samples (n=610). (B) Scatter plot of the median levels of co-expressed glycolytic (x-axis) and cholesterogenic (y-axis) genes in each LIHC sample. Metabolic subgroups were assigned based on the relative levels of glycolytic and cholesterogenic genes. (C) Heat map of differential gene expression patterns in glycolytic and cholesterogenic gene clusters across subgroups. (D) Kaplan-Meier survival analyses of patients with all subtypes of LIHC; the log-rank test p value is shown. (E) Overall survival analyses in the metastatic subgroup of LIHC patients; the log-rank test p value is shown. (F) Overall survival analyses in the non-metastatic LIHC cohort; the log-rank test p value is shown.