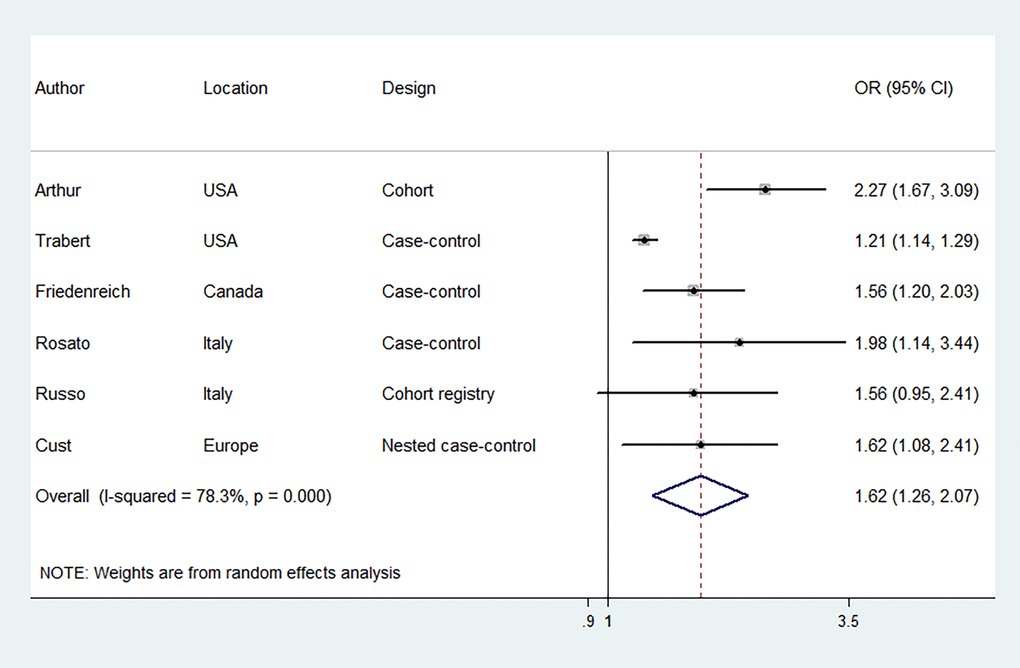
Figure 2.Forest plots (random effect model) of meta-analysis on the association between the presence of metabolic syndrome based on the National Cholesterol Education Program—Third Adult Treatment Panel criteria and endometrial cancer risk. Squares indicate study-specific ORs (size of the square reflects the study-specific statistical weight); horizontal lines indicate 95% CIs; diamond indicates the summary OR with its 95% CI. OR: odds ratio; CI: confidence interval.