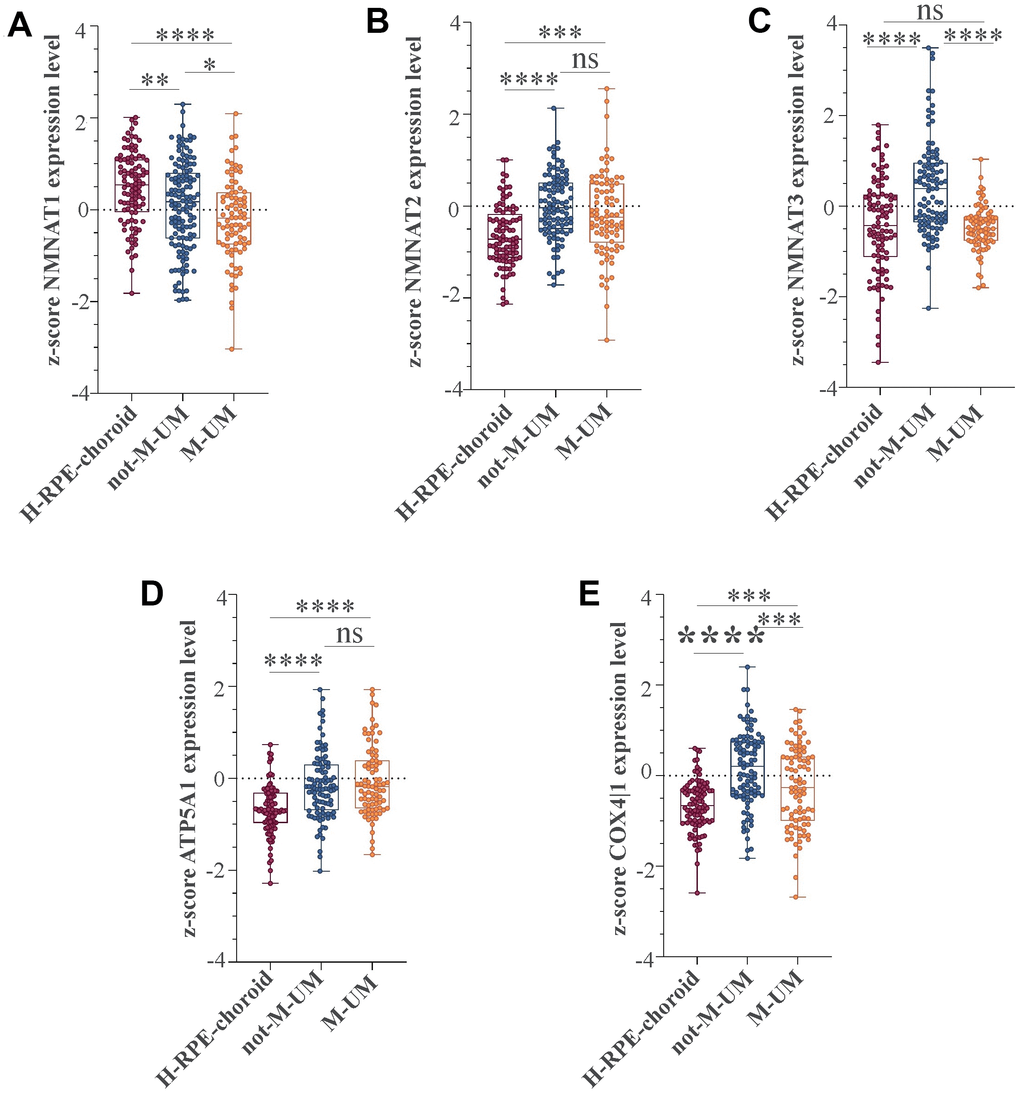
Figure 6.NMNAT1, NMAT2, NMNAT3, ATP5F1A, and COX4|1 mRNA expression levels in UM patients. Expression levels analysis of (A) NMNAT1, (B) NMAT2, (C) NMNAT3, (D) ATP5F1A, and (E) COX4|1 in 96 healthy control subjects (H-RPE-choroid), 88 metastatic (M-UM) and 102 non-metastatic (not-M-UM) UM patients. Data are expressed as z-score intensity expression levels and presented as vertical scatter dot plots. P values <0.05 were considered to be statistically significant (*p<0.05; **p<0.005;***p<0.0005; ****p<0.00005).