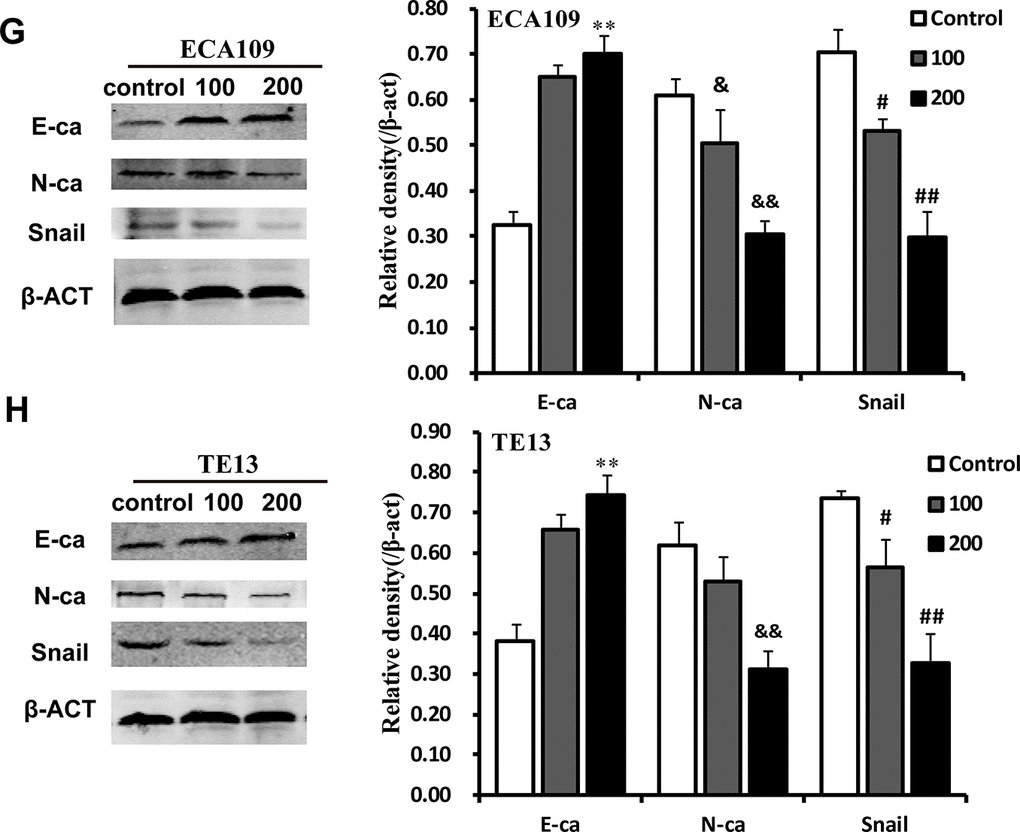
Figure 3G-H.QGS inhibits EMT in esophageal cancer cells. (G, H) Representative Western immunoblots. Bar graphs show significant dose-dependent increases in E-ca and decreases in N-ca and Snail1 relative protein density (normalized to β-act) after QSG stimulation compared to the unstimulated control group. Results are from three independent experiments. **p<0.01, E-ca relative protein density compared to control; &p<0.05, &&p<0.01, N-ca relative protein density compared to control; #p<0.05, ##p<0.01, Snail relative protein density compared to control.