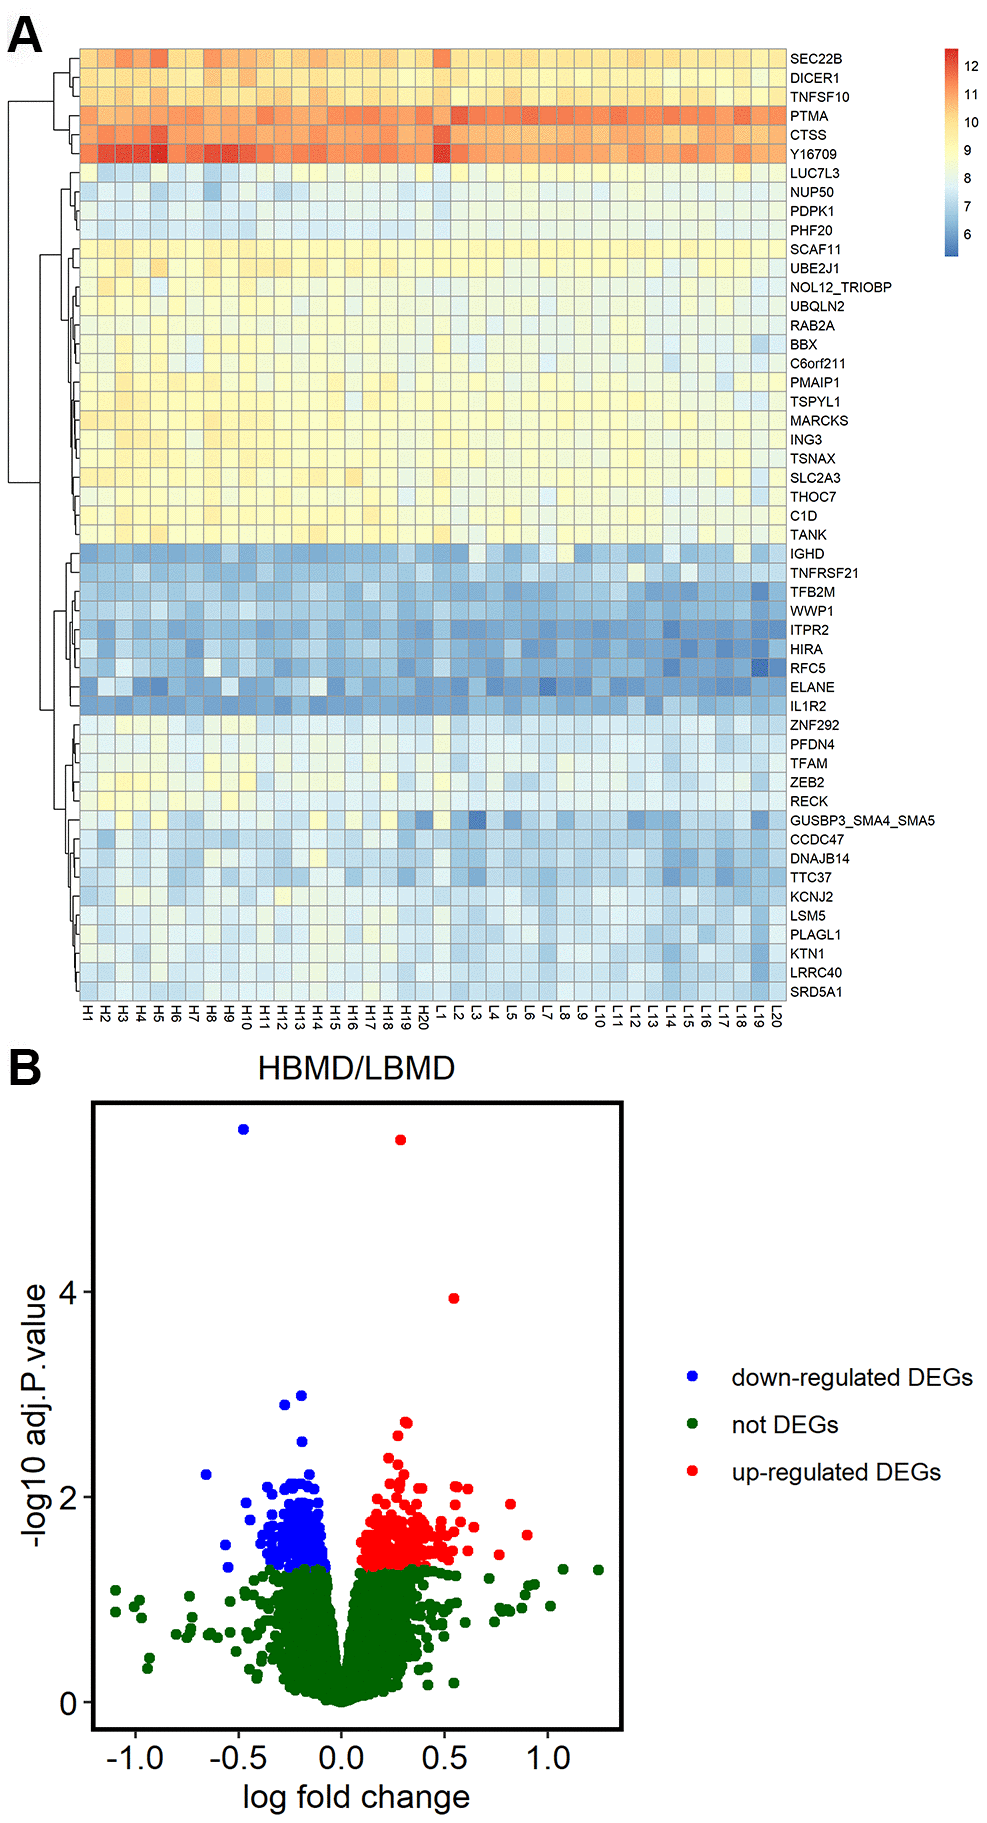
Figure 1.Differentially expressed genes in postmenopausal osteoporosis patient samples. (A) The heat map shows hierarchical clustering of differentially expressed gene expression in postmenopausal patients with or without osteoporosis (n=20 each) using the GSE56815 dataset. (B) Volcano plot shows differentially expressed genes postmenopausal patients with or without osteoporosis (n=20 each) using the GSE56815 dataset.