Submit an Article
Navigate
Home
Editorial Board
Editorial Policies
Current Volume
Archive
Scientific Integrity
Publication Ethics Statements
Interviews with Outstanding Authors
Newsroom
Sponsored Conferences
Podcast
Contact
Special Collections
Submit an Article
Online ISSN: 1945-4589
Research Paper
|
Volume 12, Issue 10
|
pp. 9328–9343
Establishing immune scoring model based on combination of the number, function, and phenotype of lymphocytes
Back to article
Figure 4
(4 of 4)
−
100%
+
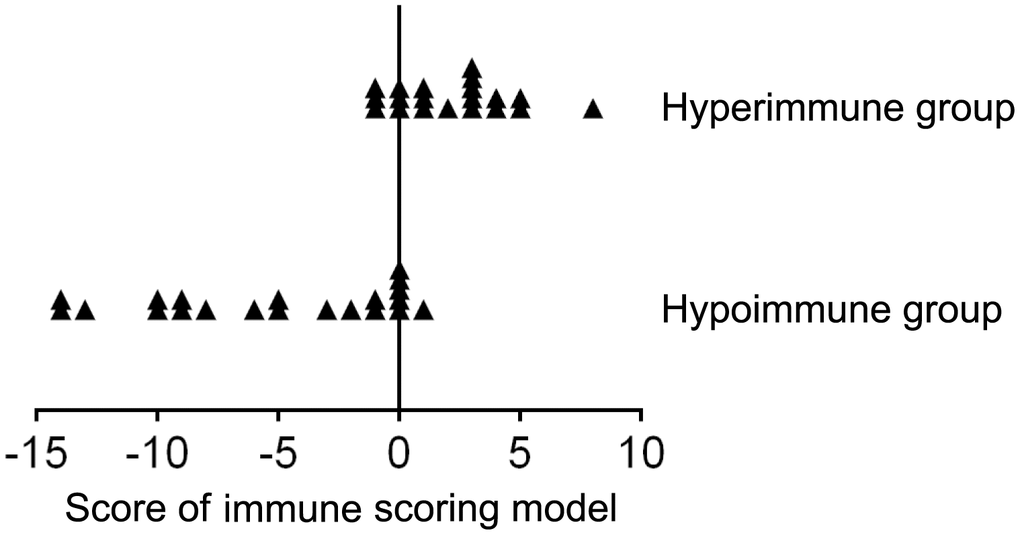
Figure 4.
The score distribution of the immune scoring model (based on combination of lymphocyte number, function, and phenotype) in patients with hyperimmune and hypoimmune status.