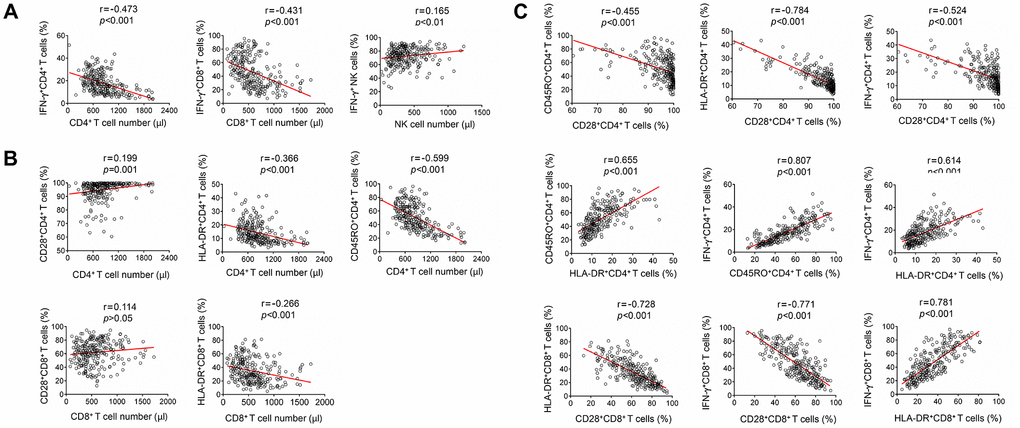
Figure 3.Correlation analysis among lymphocyte number, function and phenotype. (A) Correlation between lymphocyte function (including CD4+ T cells, CD8+ T cells, and NK cells) and lymphocyte number. (B) Correlation between lymphocyte phenotype (including the expression of CD28, HLA-DR, and CD45RO on CD4+ T cells or CD8+ T cells) and lymphocyte number. (C) Correlation among different lymphocyte phenotype markers (CD28, HLA-DR, and CD45RO), or correlation between lymphocyte function (including CD4+ and CD8+ T cells) and lymphocyte phenotype. Each symbol represents an individual donor.